This is the first of two guest posts this week about air quality forecasting by Bradley McLamb, a SCO alum and meteorologist with the NC Division of Air Quality. Today’s post looks at the basics behind air pollution and the informative index used for air quality forecasts.
Air pollution can harm people’s health and damage the environment. The two biggest air quality problems in North Carolina are ground-level ozone and particle pollution. Both pollutants are caused, in part, due to emissions from cars and trucks, and from large utility and industrial sources that supply most of our electricity.
Pollution Basics
Ground-level ozone forms when nitrogen oxides (NOx) — a byproduct of combustion — react with volatile organic compounds (VOCs) — found in both anthropogenic (e.g., cars, factories) and biogenic (trees and vegetation) sources — in the presence of heat and sunlight. This type of ozone is highest in the late spring and summer because this is when we receive the strongest solar radiation, and our days are longest.
Ozone is a strong respiratory irritant, and can cause serious health problems, especially for sensitive groups: children, people with asthma and other respiratory ailments, and anyone who works or exercises vigorously outdoors. Symptoms of ozone exposure can include coughing, throat irritation, chest pain, rapid and shallow breathing, and asthma attacks. High childhood exposure to ozone pollution may reduce lifetime lung function. High ozone levels also damage vegetation, reducing growth rates and crop yields.

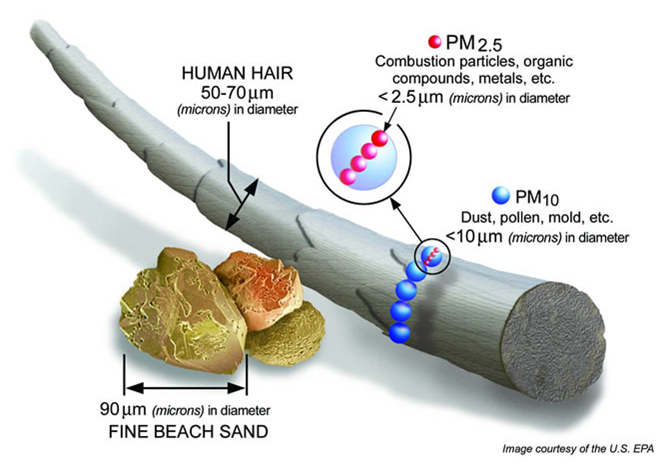
The other main pollutant, called particle pollution, consists of a mixture of tiny solids and liquid droplets suspended in the air. Particles include acids, nitrates, sulfates, organic chemicals, metals, soils or dust, and allergens such as fragments of pollen or mold spores. These particles come in a wide range of sizes, but those known as “fine” particles — 2.5 micrometers and smaller in diameter — are of particular concern because they can penetrate into our lungs.
In healthy children and adults, short-term exposure to elevated particle levels may cause minor irritation of the airways. However, long-term exposure to particles has been associated with reduction in lung function, chronic bronchitis, bacterial or viral respiratory infections, and most seriously, heart and lung diseases.
The Air Quality Index

Due to the hazards of air pollution, the NC Division of Air Quality employs a team of meteorologists who are responsible for developing a daily air quality forecast for metropolitan areas in the state using the Air Quality Index (AQI) — a color-coded, numerical index.
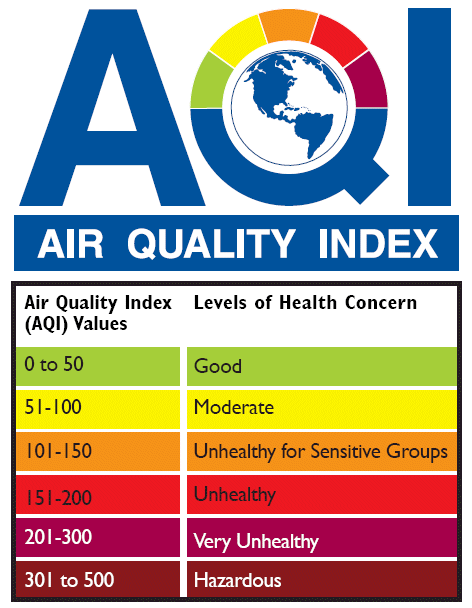
The AQI color codes (Green, Yellow, Orange, Red, Purple, and Maroon) give folks a clear, concise message about what to expect the air quality to be like on a given day, while the numerical value corresponds to the expected maximum 8-hour average ozone concentration, which is the basis for the Environmental Protection Agency’s ozone standard. For example, if we forecast pollutant levels to yield an AQI of 58 — Code Yellow — then ozone levels can be expected to be closer to the Code Green range than the Code Orange range.
When the AQI is forecasted to be in the Code Orange range or higher, either ozone or particle pollution levels are expected to pose a threat to human health, and appropriate actions to prevent excessive outdoor activity and exertion are recommended for everyone.
The most frequent occurrence of poor air quality episodes across the state comes from high ozone levels during the summer. This is no coincidence, either. Ozone formation favors abundant sunlight, dry air, light winds, and warm temperatures, all of which can occur on a hot summer day.
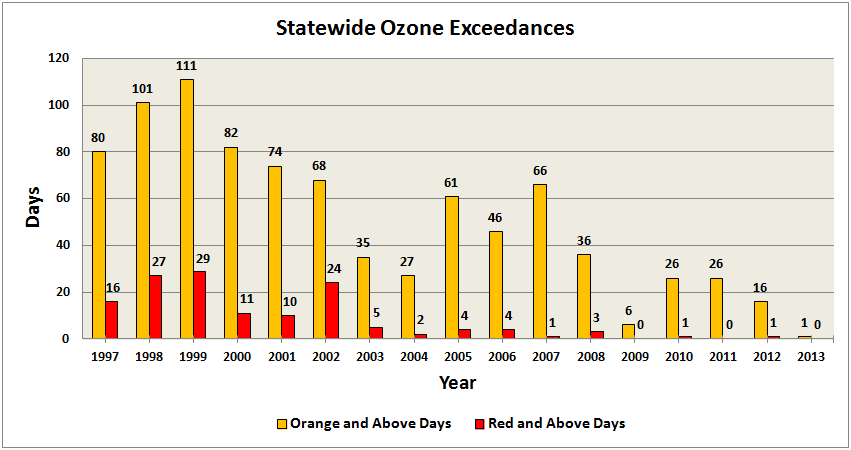
Over the past ten years, regulations enacted to reduce emissions of pollutants from vehicles and power plants have dramatically reduced occurrences of ozone concentrations exceeding levels deemed unhealthy by the EPA:

However, during late June 2012, a large portion of the Central and Eastern U.S. experienced not only a historic heat wave that broke or tied numerous all-time daily high temperature records, but also the most significant high ozone episode seen in many years. This event was a textbook case of favorable meteorological and climatological conditions needed for a widespread significant high ozone event.
In our follow-up post, we’ll explore this event in more detail including a closer look at the meteorological and longer-term climatological conditions that ultimately led to this poor air quality episode.