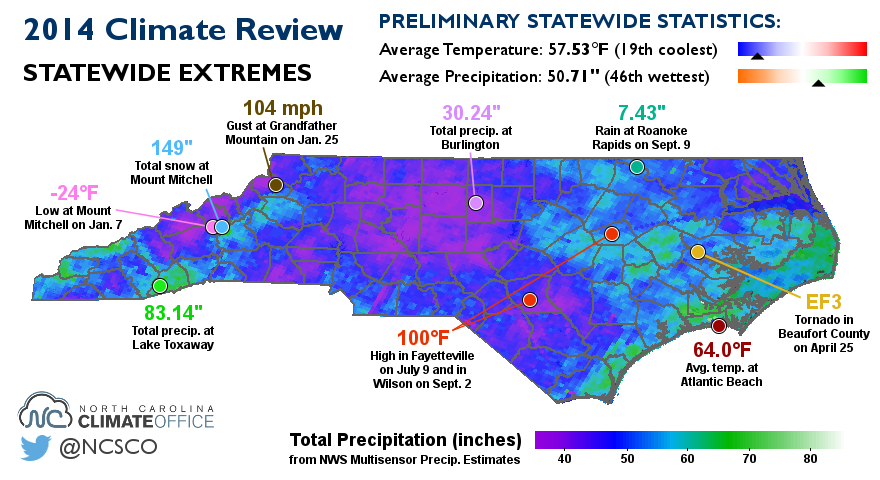
![](https://climate.ncsu.edu/wp-content/uploads/2021/03/hatteras_snow-360x216.jpg)
Recent Posts
![](https://climate.ncsu.edu/wp-content/uploads/2021/03/hatteras_snow-360x216.jpg)
![](https://climate.ncsu.edu/wp-content/uploads/2021/03/BTN2014-infographic-360x216.png)
2014 Climate Review: By the Numbers
In the first part of our 2014 climate review for North Carolina, we look at some statewide statistics and extremes from the past year. Temperatures...![](https://climate.ncsu.edu/wp-content/uploads/2020/11/mpe_spr2014_percnorm-360x216.png)
Spring 2014 Started Cool, Finished Warm in NC
This is the second post in our 2014 summer outlook series. Today we review our spring temperatures, precipitation, drought, and severe weather. Statewide Average Precipitation:...![](https://climate.ncsu.edu/wp-content/uploads/2021/03/hail_chart-360x216.jpg)
An Introduction to our Severe Weather Tools
The World Meteorological Organization defines severe weather as dangerous meteorological phenomenon, of varying duration, with risk of causing major damage, serious social disruption and loss...![](https://climate.ncsu.edu/wp-content/uploads/2021/03/tornado_test-360x216.png)
Summer Projects: Rainfall Study and Severe Weather Stats
This post is part of a series highlighting the summer projects from our office’s undergraduate research assistants. First up is Colin Loftin, a senior in...![](https://climate.ncsu.edu/wp-content/uploads/2021/03/precip_Dec2012-360x216.png)