The World Meteorological Organization defines severe weather as dangerous meteorological phenomenon, of varying duration, with risk of causing major damage, serious social disruption and loss of human life. The State Climate Office website provides information on and illustrations of some of the different types of severe weather.
Severe Storm Stats
Last fall, our information pages on thunderstorms and associated severe weather (hail, high winds, tornadoes, and lightning) were updated. New graphs and charts were added to help visualize hail, high wind, and tornado numbers as well as provide the raw values themselves.
- Note: Since this blog post was originally published, these graphs have been consolidated into our Severe Storm Reports Tool.
Bar charts provide insight into the frequency and timing of historical severe weather events. For instance, May is the month with the highest number of NC hail reports. In addition, hail has been observed at least once during every month of the year (see image below).
Pie charts break down the different types of severe weather by relative scales; for example, the percentage of F-1 tornadoes in North Carolina is 38%.
In addition to providing numbers on reports of tornadoes, the tornado pages also have information about injuries and fatalities caused directly by tornadoes. The graph on the “Tornadoes by the Numbers” page also has the option of displaying a line chart that contains reports, injuries, and fatalities all on the same graph, allowing for direct comparisons between the three.

Local Storm Reports
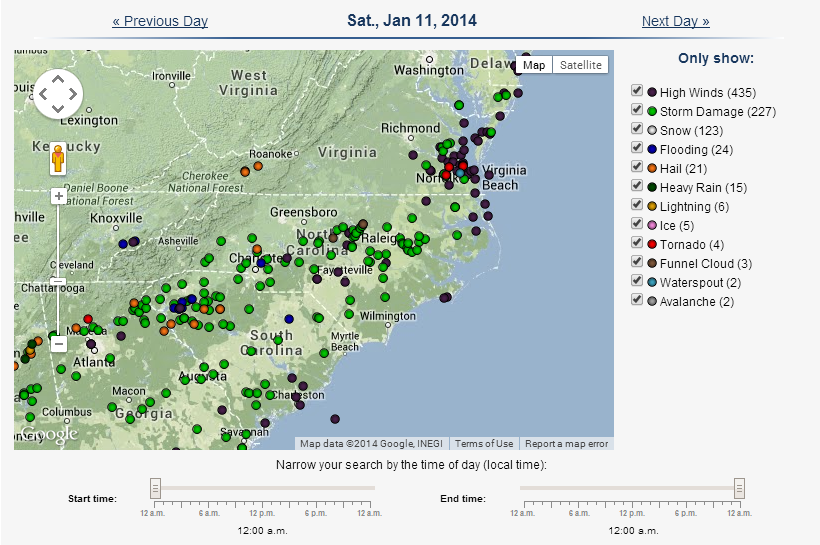
When severe weather happens across the country, National Weather Service offices receive and transmit Local Storm Reports (LSRs), which tell when and where the weather happened. Reports are available nationwide since mid-2001. Our office collects LSRs, which users can search for and view through our Local Storm Reports Database. There are two ways to search the database:
- To view reports by date: Enter a date of interest in the red search box on the left. Click “Submit” to view a map of all reports on that date. We receive new reports every 10 minutes, so if you’re looking at today’s date, you can track storm events as they unfold.
- To view reports by location: Use the blue search box on the right to find reports near a given location. Enter your state and county, or click the “alternate locations” option to enter a specific location such as a city and state, along with the surrounding distance to search. To narrow down your search based on the dates or event types, click “advanced options”. When you click “Submit”, you’ll see a table and map of reports that match your search criteria.
Along with thunderstorm events, LSRs include reports of winter weather hazards, storm damage, and flooding and heavy rain. This makes the LSR Database a great tool to track recent weather events in your area.
- Note: Since this blog post was originally published, our Local Storm Reports Database has been retired. You can now view these using the National Weather Service’s Local Storm Reports App.