November 2012 was Cool and Very Dry
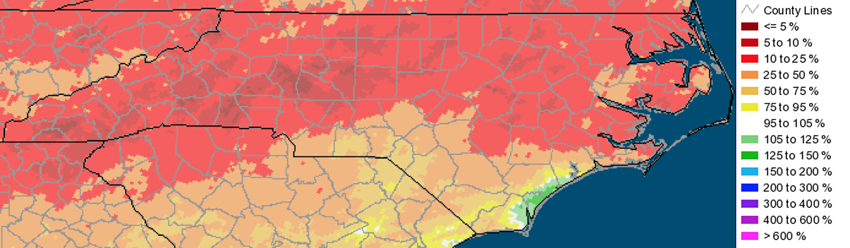
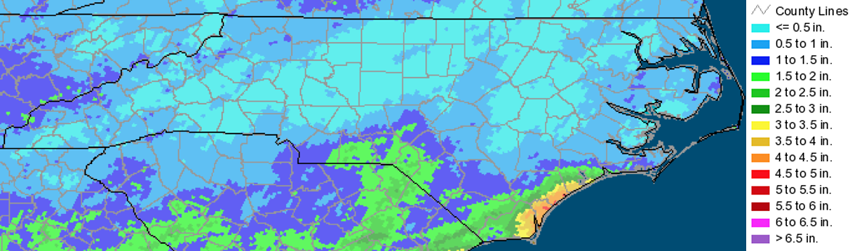
You may have noticed it hasn’t been raining much. The numbers from reporting gauges across the state would confirm that observation. November 2012 was dry in North Carolina: very dry. Most of the state received less than an inch of rainfall in November. Statewide, it ranks as the 7th driest November on record (since 1895). This was the driest November in statewide averages in NC since 1933. The driest November on record was in 1922. Radar-based precipitation estimates shown below capture the dry pattern well across the northern 2/3 of the state.
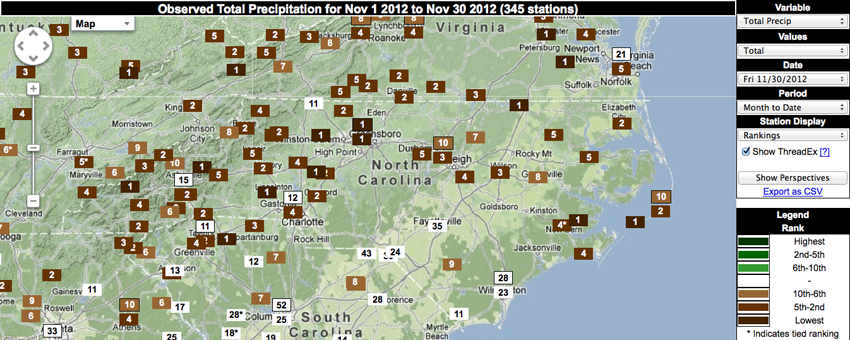
Most reporting gauges across the state reported top 5 driest November on record. Most notable among these was the report of 0.24 inches of rain at Greensboro Airport which ranks as the driest November in that station’s 110 years of record. Using Climate Perspectives, the rankings for dryness become clear.
This dry weather was accompanied by cool temperatures. High pressure has dominated our weather pattern over the past 30 days. During the warm season, high pressure tends to be associated with unusual heat. During the cool season, high pressure is often associated with below-normal temperatures. Statewide, November 2012 ranked as the 9th coldest November on record and the coldest November since 1996. The coldest November on record for North Carolina statewide averages was 1901.
The Climate Perspectives tool helps illustrate the local variations in this cold temperature pattern.
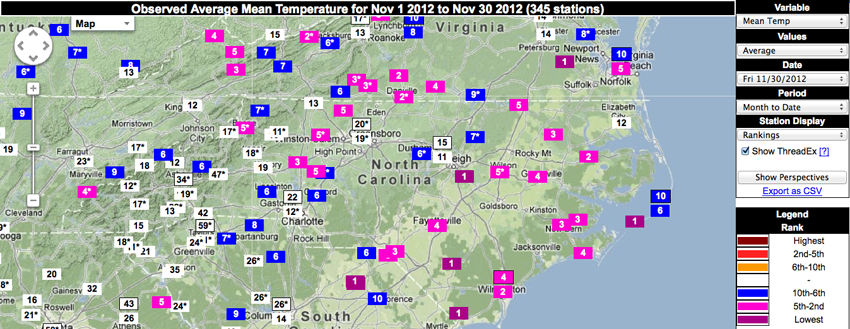
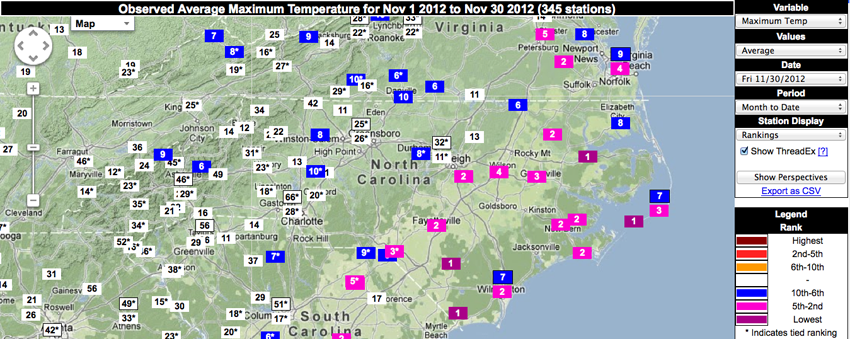
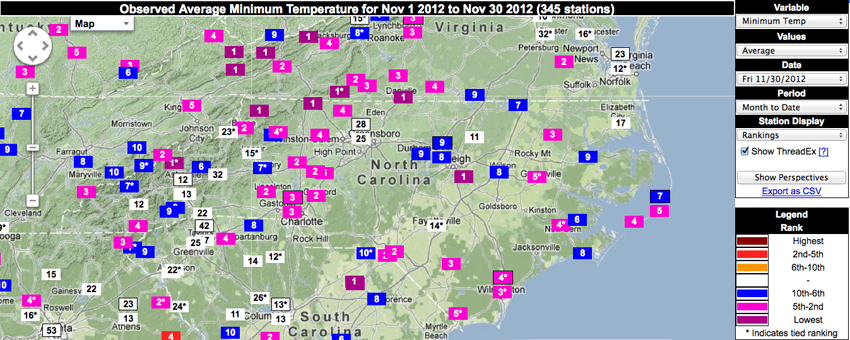
The most pronounced pattern seen in this is that, for most locations, minimum temperatures ranked higher (more cold) than maximum temperatures. Given the very dry in November, this makes some sense. High pressure brought very dry air with low dew point temperatures (and little precipitation). Drier air allows heat radiation to escape more readily overnight as compared to moist air, thus allowing the air temperatures near the surface to drop more quickly and reach colder minimum temperatures.
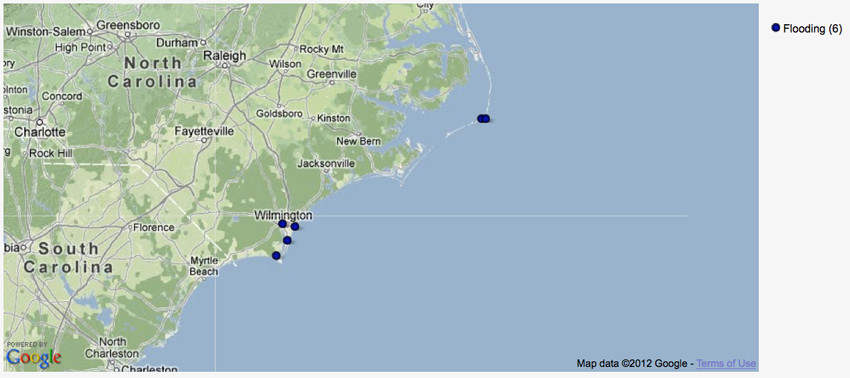
Otherwise, it was a very calm month. Indeed, since I’ve been watching the Local Storm Report summaries, this is the month with the fewest reports. With a Nor’easter situated off shore in mid-November, there were several reports of coastal flooding and overwash along the barrier islands. But that’s it — 6 local storm reports in November 2012.
Impacts to Water Resources
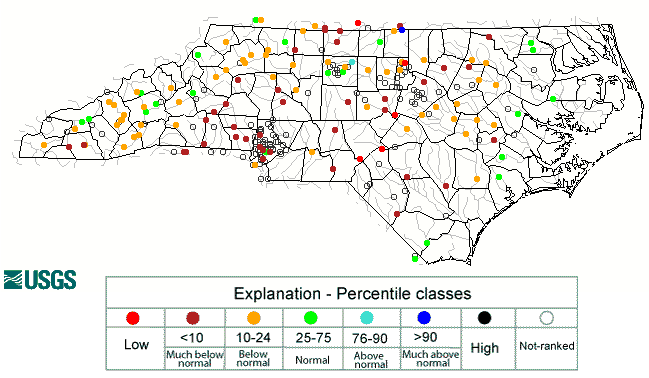
As you might guess, dry weather means a drop in stream and reservoir levels. And as you might expect, the locations of low streamflow reports match well with the driest parts of the state.
Low streamflow and little rain mean less water coming into our surface reservoirs. At the end of November, all of the reservoirs operated by the US Army Corps of Engineers were below normal. Some reservoirs (John H. Kerr, Jordan, and W. Kerr Scott) were more than 2 feet below normal. Similarly, many of the reservoirs operated by Duke Energy were down. A few towns are looking at implementing water conservation controls in response to the dry conditions.
Impacts to Agriculture
Dry conditions in the late fall can be a blessing for many growers. For cotton and soybean harvest, dry fields make it much easier for those big harvesters to get in and get out quickly. However, for growers who have planted or are looking to plant winter grains, or for those looking to renovate pastures, the dry conditions are causing problems. They need adequate moisture in the soils to help with establishment and early growth.
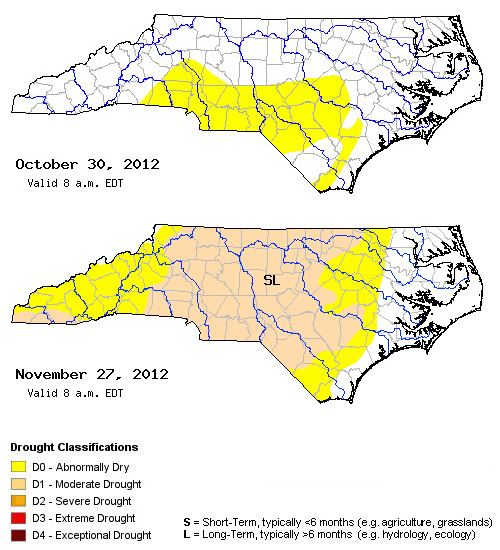
US Drought Monitor
With near record dryness and hints of water restrictions, you’d expect some dramatic deterioration in the US Drought Monitor, right? And we’ve seen widespread expansion of D0 and D1 (moderate Drought) in North Carolina. But why not more? Drought without impacts is just dry weather. This same amount of rainfall in June would produce widespread severe to extreme drought conditions because June is when we would experience more impacts to our water resources and agriculture.
But during the cool season, impacts from dry weather are more difficult to find. Most water that falls during the cool season goes directly into recharge for groundwater, streams, and reservoirs. Evaporation rates are low, and there are few actively growing plant life to pull moisture from the soil and transpire it back into the atmosphere. So while it’s been very dry, the impacts from that dryness are much less than it would be in spring and summer. Lesser impacts mean lesser drought, and why the US Drought Monitor doesn’t show extreme drought right now.
- Categories:


