A Warm, Wet July Extends Our Steamy Summer

The heat held on in July, joined by locally heavy rainfall that improved drought conditions. We also review recent weather using the new Almanac feature in our Station Scout tool.
The Peak of Summer Heat
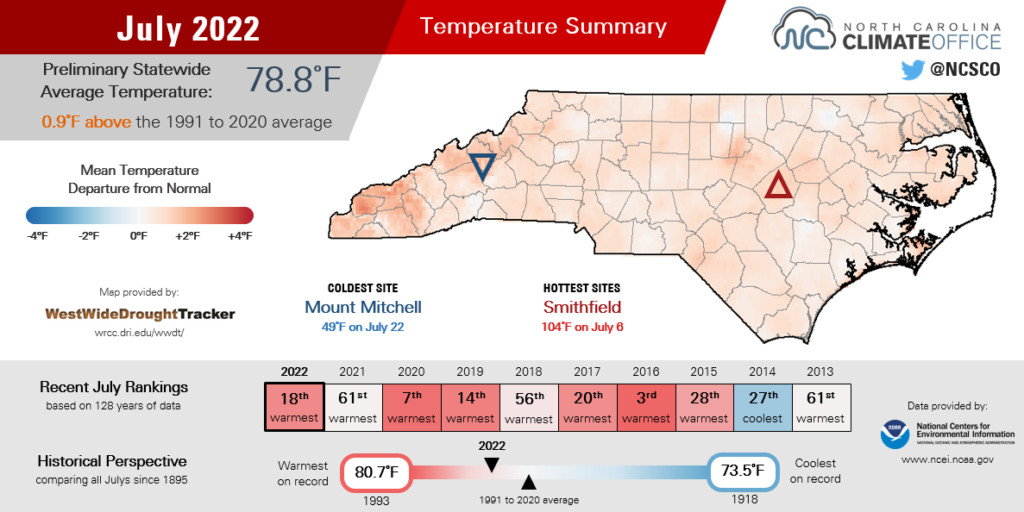
Climatologically speaking, July is our hottest month of the year, and last month indeed saw the temperatures dialed up, even compared to typical mid-summer levels. The National Centers for Environmental Information (NCEI) reports a preliminary statewide average temperature of 78.8°F, which ranks as our 18th-warmest July since 1895.
The month was notable for several stretches of heat, beginning just after Independence Day. With high pressure in place over the Southeast US, temperatures reached 102°F in Raleigh on July 6 and 7 to tie its record high on both days.
That makes three hundred-degree days for the capital city so far this summer, which is the most at this point in the year since the nine triple-digit days in both 2011 and 2012. Raleigh has also reached at least 90 degrees on 48 days in 2022, which is the fourth-most through the end of July dating back to 1887.
With Raleigh being one of the hottest spots in the state last month, we’re reminded of the Urban Heat Island Temperature Mapping Campaign conducted last July in Raleigh and Durham. Volunteers equipped with temperature sensors drove, biked, and walked both cities, and we found some sharp differences between the hottest and coolest areas. For more on that project, including maps of the observed temperatures, check out our UHI website.
This July, the early-month heat was followed by a rare round of mid-summer relief. On Sunday, July 10, behind a cold front and with cooler air funneling in from the north, high temperatures were stuck in the 70s – readings more typical of mid-April than mid-July.
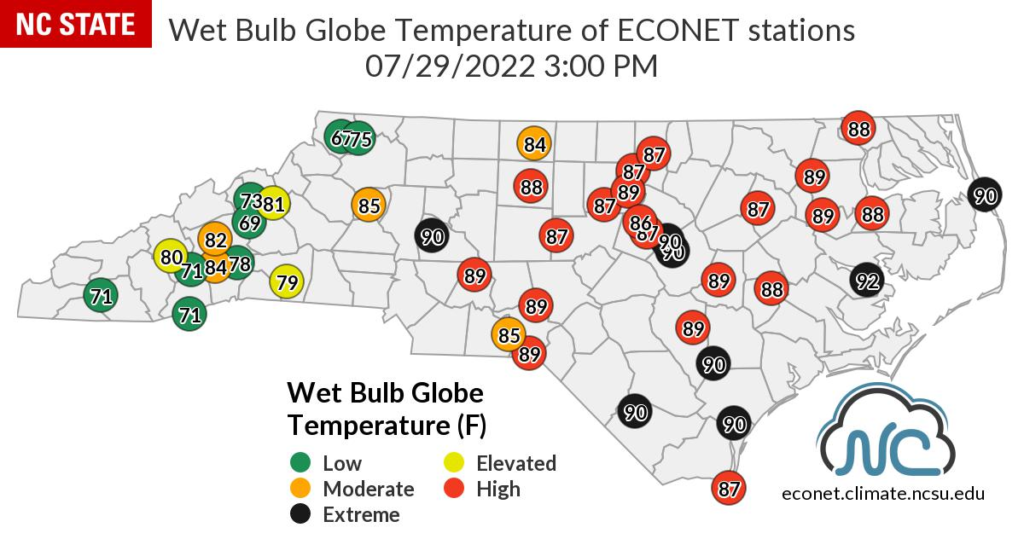
That cool weather was fleeting, as high pressure building over the Carolinas again elevated us into the 90s early in the following week. We also finished the month on a stretch of days with temperatures the upper 90s, and the Wet Bulb Globe Temperature — a measure of human heat exposure — reached extreme levels across parts of the Piedmont and Coastal Plain, which meant heat exhaustion could occur in as little as 15 minutes for those working or exercising in direct sunlight.
Even some mountain sites climbed well into the 90s last month. Murphy has now measured 20 days at or above 90°F so far this year, which is tied for the 8th-most in the past 44 years and the most there since 2012.
Our minimum temperatures also stood out last month as a series of humid air masses in place prevented our temperatures from falling much overnight. Statewide, it was our 6th-warmest July on record based on the average low temperature of 69.3°F. Five of our eight warmest Julys as ranked by the average lows have happened since 2011.
Greensboro tied a daily record on July 28 for its highest low temperature of 74°F. That nighttime low was 4 degrees warmer than the afternoon high on July 10, emphasizing just how out-of-season that spring-like Sunday truly was.
With another month of summer to go — and a tendency for North Carolina heat to stretch in the fall — a useful new resource is the National Integrated Heat Health Information System at HEAT.gov. It includes detailed information about heat risk now and in the future, along with tips for staying safe when exposed to the heat.
Showers and Storms Make a Dent in the Drought
Scattered storms left some places soaking last month while others remained dry. Those mixed fortunes are reflected in the preliminary statewide average precipitation of 6.04 inches, which was our 47th-wettest July in the past 128 years, according to NCEI.
One of the wettest parts of the state last month was the central Coastal Plain. New Bern had its 6th-wettest July on record with 11.58 inches, while the National Weather Service office in Newport measured 16.57 inches and its wettest July in the past 25 years.
That total included light rain from the remnants from Tropical Storm Colin early in the month, then three straight days with at least an inch of rain from July 8 to 10, plus 4.64 inches on July 24 – the greatest single-day total there since Hurricane Florence in September 2018.
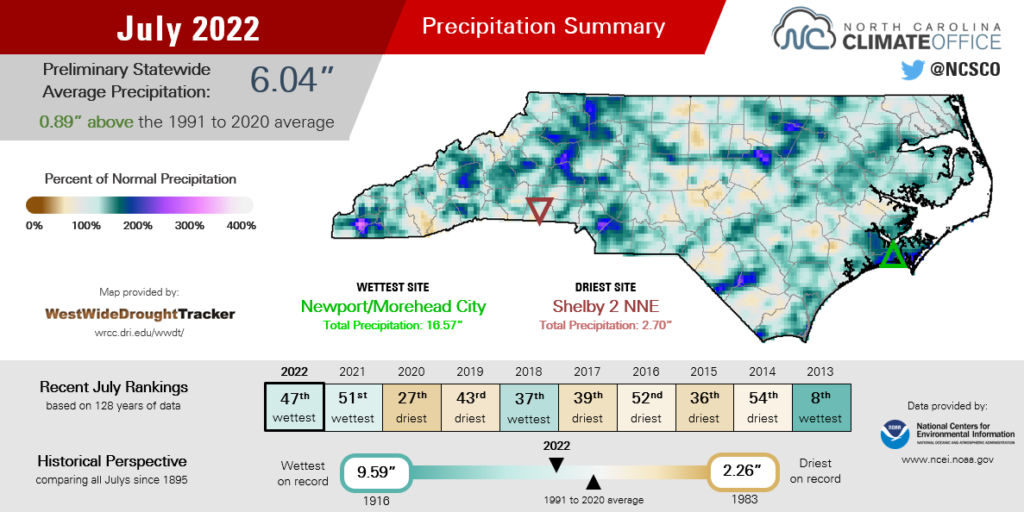
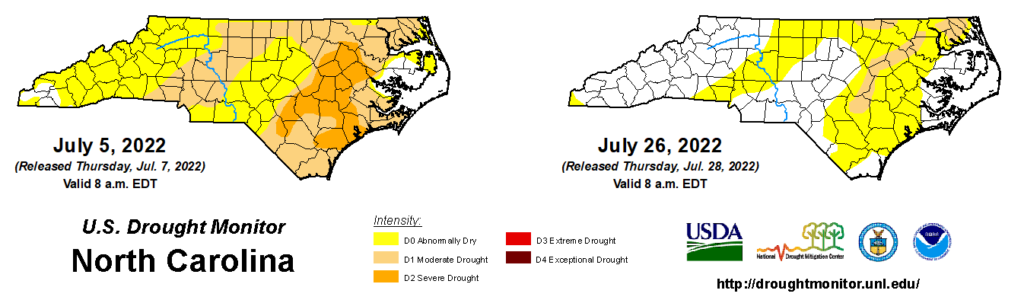
While parts of our southern and central coastline were in Moderate (D1) or Severe Drought (D2) entering July, the heavy rains helped eliminate those local drought conditions entirely and replenish streams and wetlands that had dried out in the early summer. We wrote about the characteristics and benefits of these water features in the Coastal Plain as part of our Curious Coast blog post series last month.
The western Piedmont also benefited from July’s rainfall to improve from Moderate Drought back into the Abnormally Dry (D0) classification on the US Drought Monitor. Notably, Hickory had its 3rd-wettest July with 10.18 inches and Greensboro had its 20th-wettest July in the past 120 years with 7.01 inches total.
Showers and storms on July 20 were particularly damaging across the western half of the state. Rainfall totaled more than 4 inches near Marble in Cherokee County, which caused mudslides and prompted the evacuation of homes and a campground.
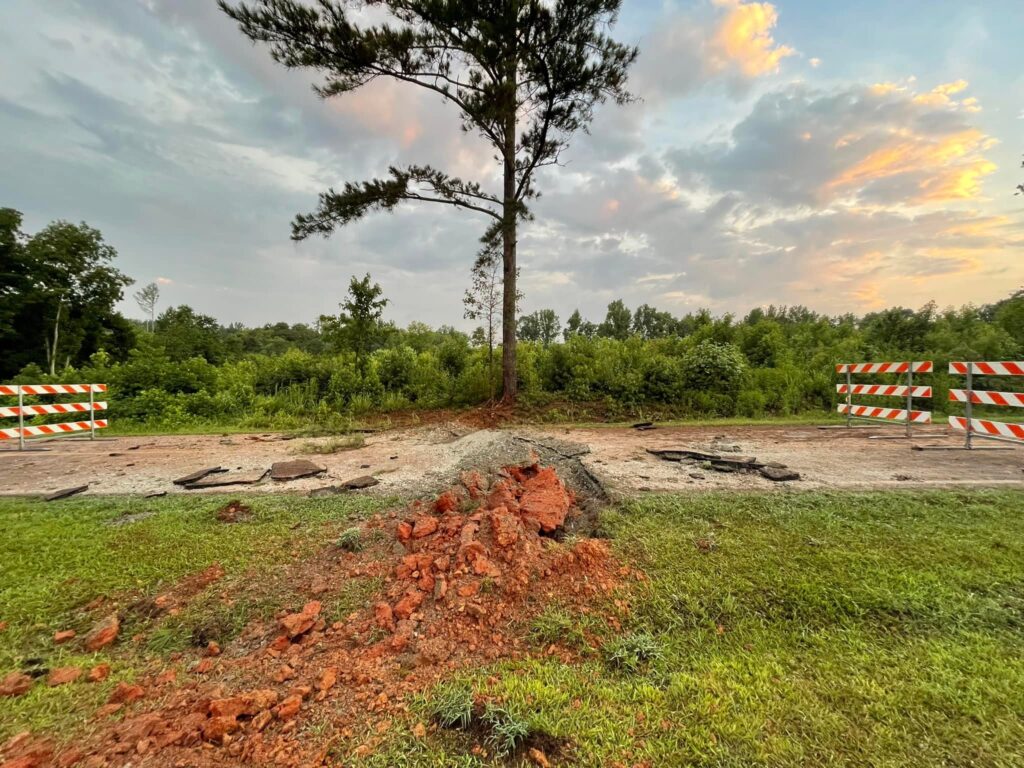
That same night in the Stanly County town of Oakboro, a lightning strike to a tree penetrated the ground, which damaged a road and sent debris flying onto a nearby roof, per the Oakboro Police Department.
In between those wet and storm-struck areas, a few spots stood out as drier, including the far northeastern corner of the state. Elizabeth City had 4.80 inches in July, which was 0.9 inches below normal, and it’s 3.6 inches below normal since the start of the summer.
For now, Moderate Drought persists in parts of the northern Coastal Plain where seasonal precipitation deficits are present and monthly average streamflows were below normal in July.
We’re not completely out of drought just yet, and recent rains may have come too late for some crops such as early-planted corn to fully recover. However, we’re certainly in better shape than we were one month ago, with Severe Drought in the Coastal Plain washed away by July’s rainfall.
Scouting the Summer with Our Almanac Feature
Last spring, we launched our Cardinal system as a new way to request and retrieve historical weather data. Eighteen months and more than 4,000 requests later, Cardinal is still going strong – but that doesn’t mean we’re finished making improvements!
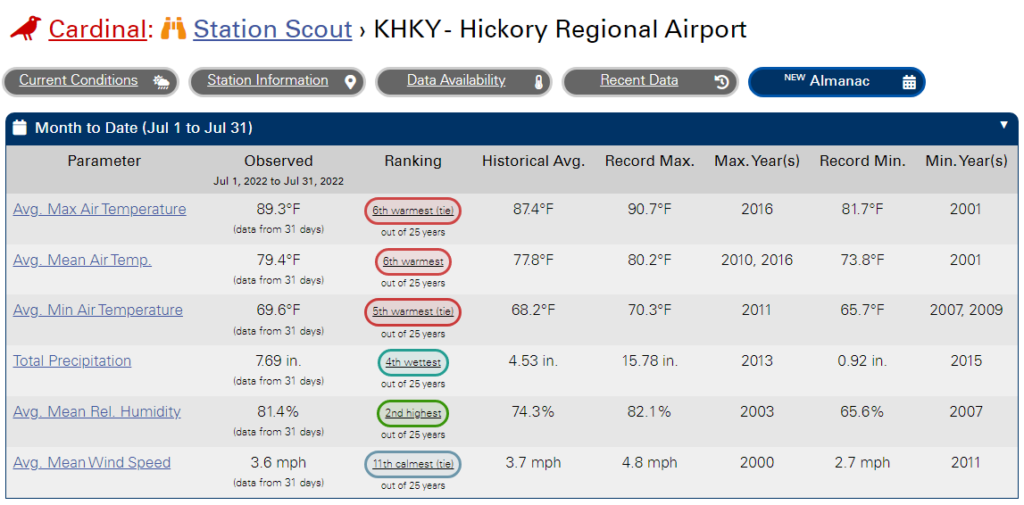
In July, we unveiled a new addition to Station Scout, our tool for exploring weather stations across the state. The Almanac feature helps put recent conditions into a historical perspective using rankings, ranges, and other displays.
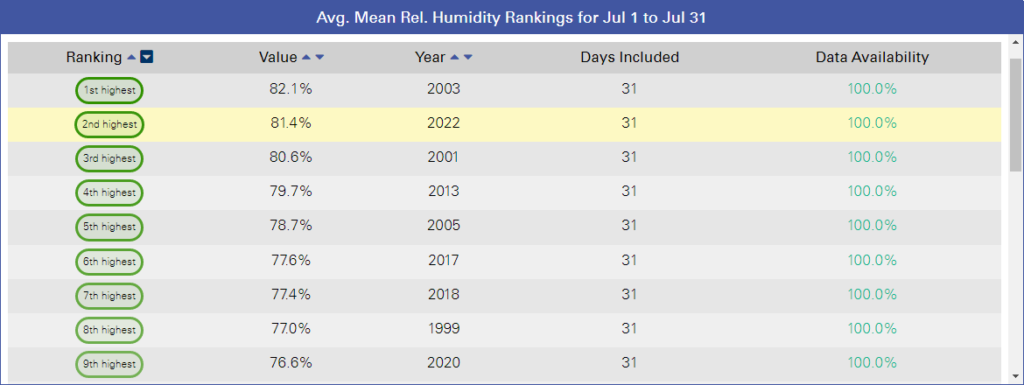
To see what the Almanac can offer, let’s start by looking at how humid the past month was in some of the wettest areas. In Hickory, the average July humidity of 81.4% was the 2nd-highest out of the past 25 years.
Clicking that color-coded statistic opens a list of all Julys ranked by their relative humidity, which shows that only July in 2003 was muggier in Hickory.
We can also see how our temperatures stack up so far this summer. Raleigh is on pace for its 3rd-warmest summer on record based on its mean temperatures, and its 4th-warmest based on the maximum and minimum temperatures.
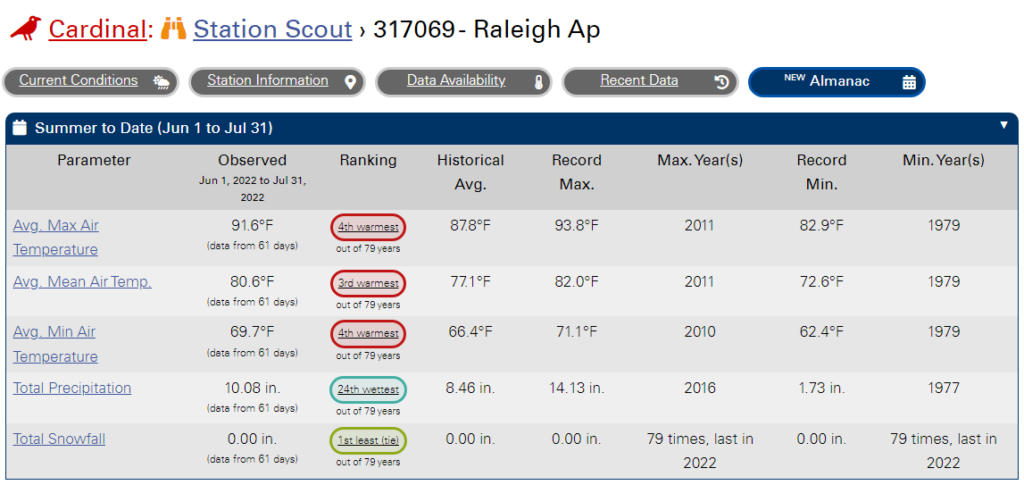
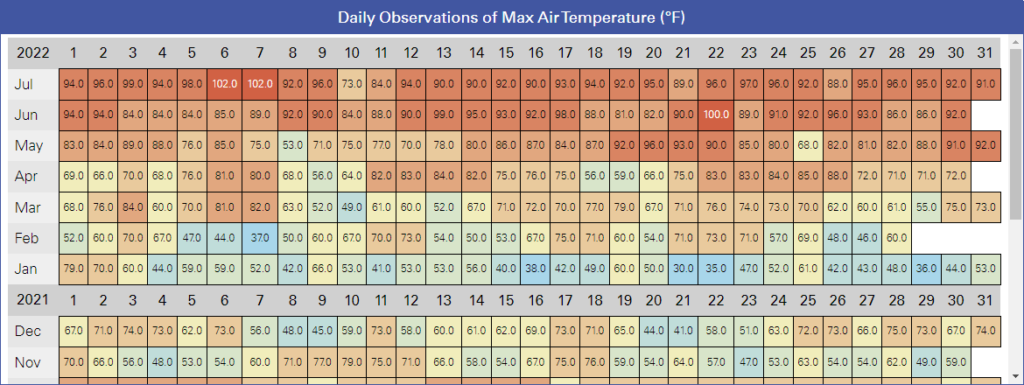
To see when the temperatures have been the hottest, click on a parameter name, such as “Avg. Max Air Temperature”, to reveal a table of daily observations. This clearly shows the three days this year when Raleigh has reached 100 degrees – and those comfortable spring days we long for amid our recent heat.
Finally, in areas where storms have blown through, we can see how windy the past month was. In Southport, this was the 2nd-windiest July out of the past 18 years. Only July 2012 had a higher average wind speed.
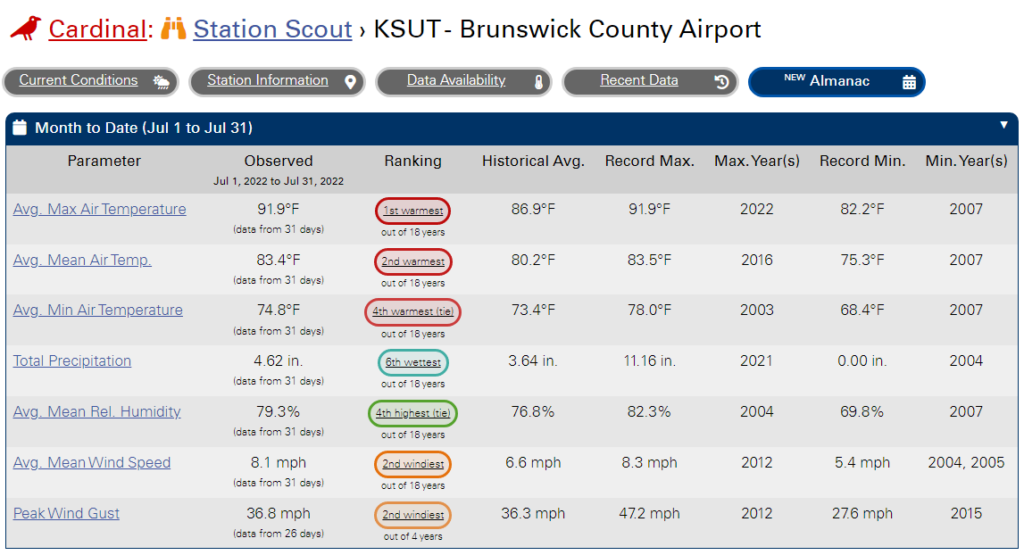
To view these statistics for stations in your area, check out our Station Scout tool, choose a station using the map and search options, and then click on the “Almanac” tab at the top of that station’s page.
You can select a custom date and view data ranging from a single day to the year-to-date so far. That makes Scout an even more powerful way to explore and visualize our weather.
- Categories:


