Point Datasets
Observations made at weather stations offer a critical ground truth when monitoring ambient conditions. Even the most high-resolution forecasts and gridded analyses can sometimes fail to capture a localized weather feature, whether it’s a passing shower or thunderstorm, a terrain-induced wind shift, or a pocket of dry sinking air.
Weather is the most variable of the three main factors that affect fire behavior, so knowing exactly what local weather conditions are doing — and how they’re changing — can help you better prepare for a burn or adjust your strategy in response to the latest information.
Station Networks
The Fire Weather Intelligence Portal brings together weather observations from a number of different networks across North Carolina and the Southeast US. While most of these networks measure the same or similar parameters, there are some important characteristics and differences to be aware of as you’re using the Portal:
- RAWS: Nationwide, the most common source for fire danger data is the Remote Automated Weather Station, or RAWS, network. These stations are deployed on natural lands with the goal of tracking conditions for forestry and fire purposes. RAWS stations are generally operated by federal or state forestry services or other agencies and organizations that manage tracts of land. The standard construction of RAWS station consists of a tripod-like tower with temperature, humidity, and other basic sensors at a height of 2 meters or 6 feet, along with an extended arm to a 6-meter or 20-foot that includes wind sensors. RAWS stations report data once per hour, and we retrieve this data via the Synoptic API before displaying it in the Portal.
- NC ECONet: At the NC State Climate Office, we manage and maintain our own network of research-grade weather stations across the state called the ECONet. From Appalachian peaks to research farms across the Coastal Plain, the ECONet is designed to provide high-quality observations to support decision-making, including for forestry and fire weather. To that end, all ECONet sensors have been equipped with 6-meter/20-foot wind sensors in addition to the standard 2-meter instrumentation. Like RAWS stations, ECONets measure solar radiation, but they also have soil temperature and soil moisture sensors, making them unique among networks in the Portal. While ECONet stations report data at a one-minute frequency, only their top-of-the-hour observations are shown in the Portal.
- ASOS: Having timely weather data is also useful for the aviation sector, so to support this mission, the National Weather Service operates the Automated Surface Observing System, or ASOS, at most major passenger airports across the country. These stations report hourly observations of standard variables such as air temperature, winds, and precipitation. However, note that the wind sensor at ASOS stations is at a height of 10 meters, so the log wind profile method is used to estimate the height at 6 meters. Also, because ASOS stations do not measure solar radiation, their data cannot currently be used in the National Fire Danger Rating System. However, they can still be a useful and reliable source of local weather information.
- AWOS: Generally located at smaller airports, the Automated Weather Observing System or AWOS uses similar sensors as the ASOS, but with a few important differences in how the data is reported. Instead of making a single observation near the top of the hour, AWOS stations may report data up to three times per hour, or every 20 minutes. Precipitation is reported as the amount falling since the previous observation or since the beginning of the hour. This means for a station that makes its final observation at :45 after the hour, any precipitation from :45 to :00 is never reported, and the :05 report includes only five minutes’ worth of precipitation data. Because of this tendency to underreport rainfall amounts, precipitation data is not shown for AWOS stations.
- NC Organic Soil: Beginning in 2018, the NC State Climate Office began deploying a small network of organic soil moisture monitoring stations in parts of eastern North Carolina. These four stations have simple above-ground instrumentation limited to an air temperature/humidity sensor and a rain gauge, but beneath the ground, these stations measure soil temperature and soil moisture at five different depths between 5 centimeters and 1 meter, with three columns of sensors per station to offer extra redundancy. These stations are intended to collect several years’ worth of data, which will be used in an analysis of factors that affect organic soil moisture and fire/smoldering risk. For more about that project, view our research summary.
While there are other weather observing networks around the region, including state-specific mesonets similar to the ECONet, we have not had the funding, capacity, or means to access and store this data.
Usage Tip:
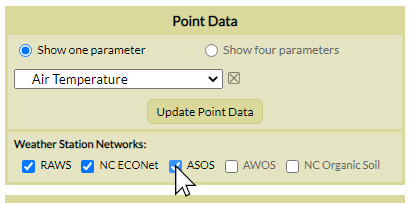
You can change which networks are displayed on the map within the Point Data menu under the Weather Station Networks heading. Toggle each network by clicking the checkbox next to it.
This can be a useful feature if, for instance, you only want to see observed 20-foot wind observations from RAWS-standard stations (RAWS and NC ECONet), and not the estimates calculated using the 10-meter winds from ASOS and AWOS stations.
Your selected networks will be saved if you copy the Bookmarkable URL.
Weather Variables
At the heart of all point datasets in the Fire Weather Portal is the raw weather observations from the station networks it displays. Here’s a quick overview of the available weather parameters in the Portal:
- Basic environmental variables such as air temperature, dew point, and relative humidity
- “Apparent temperature” variables of heat index and wind chill
- Wind speed and direction and wind gust observations are available, all measured or calculated at a height of 20 feet or 6 meters above the ground
- Solar radiation data is available from RAWS and ECONet stations
- Many RAWS stations have fuel sticks that measure an equivalent to 10-hour fuel moisture and fuel temperature
- Precipitation totals are available over intervals ranging from the most recent 1-hour to the past 90 days
This suite of weather variables can provide valuable insights about the environmental conditions near you and how they might affect a prescribed burn or wildfire.
Example:
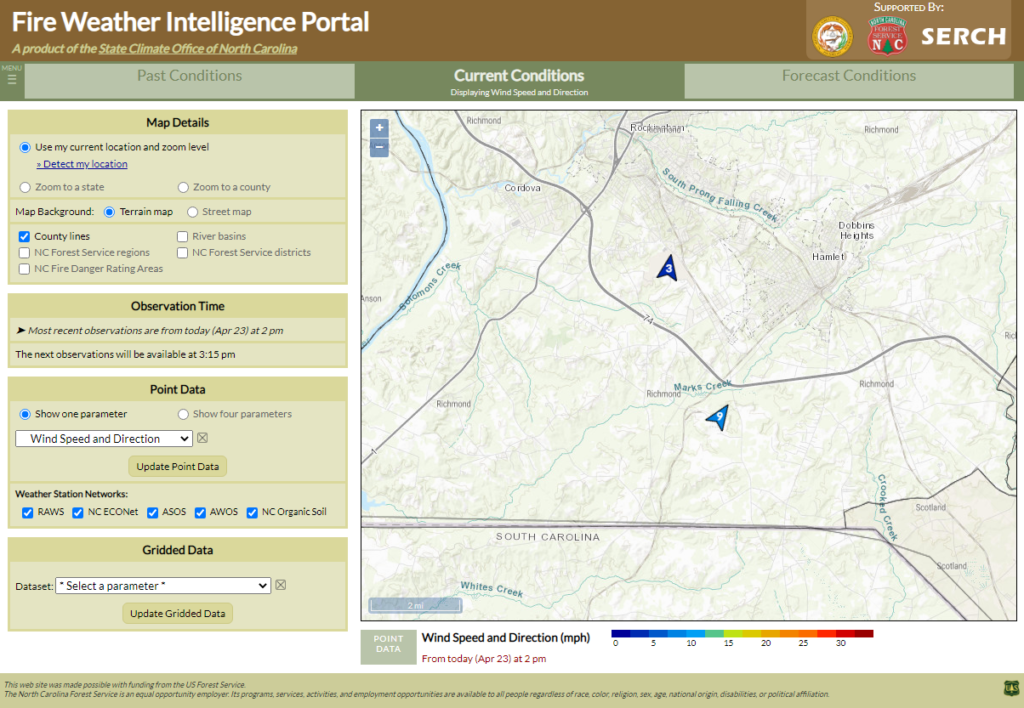
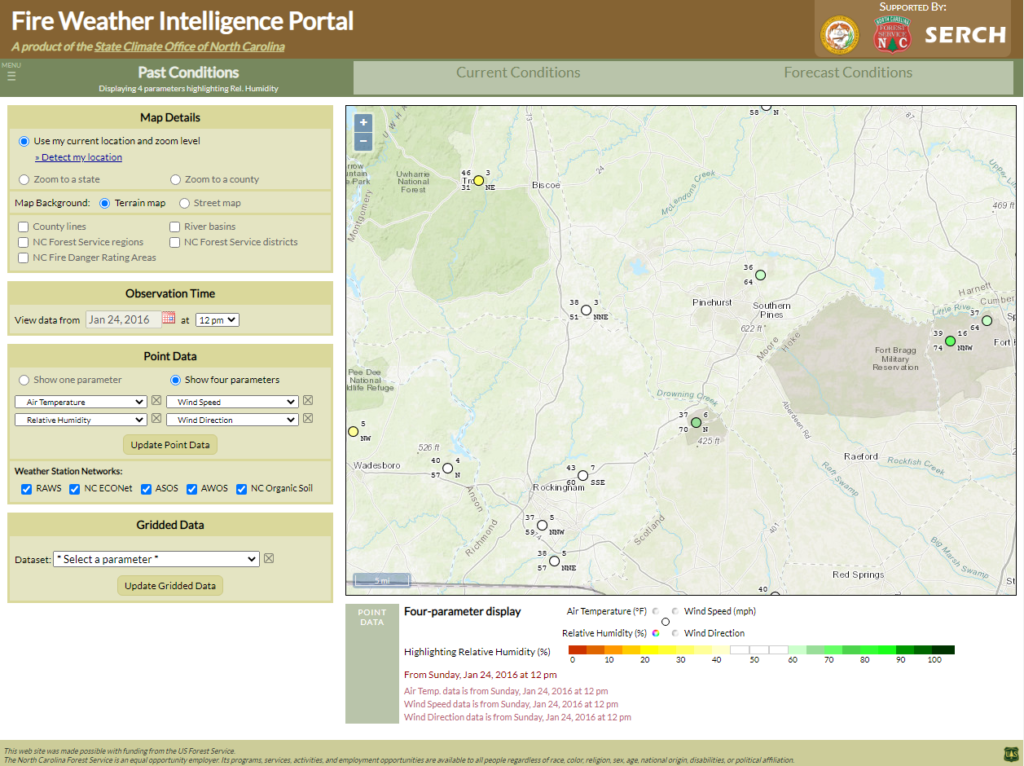
At your location in southern Richmond County, NC, burning on a day with southerly or southwesterly winds is unfavorable since it can send smoke across nearby US Highway 74. One afternoon before starting a burn, you check the Portal and view current Wind speed and direction observations from nearby weather stations.
These show a moderate southwesterly wind at both stations near your area. This knowledge helps you decide not to proceed with the burn.
Soil Variables
All North Carolina ECONet stations are equipped with soil sensors that provide valuable information for both agriculture and forestry. Data from these sensors is available in the Portal via these parameters:
- Soil temperature is measured at a depth of 10 cm. At this depth, soil temperatures show some variability during the day, but not as much as the ambient air temperature.
- The volumetric soil moisture is measured at a depth of 20 cm. It is defined as the ratio between the volume of water per unit volume — usually a cubic meter or cubic centimeter — of soil. It can be thought of as the amount of soil pore space filled with water. In the Portal, it is presented as a decimal value between 0 and 1, but it can easily be converted to a percentage by multiplying 100 (e.g., a volumetric soil moisture of 0.25 is equivalent to 25% of the soil volume filled with water).
- Soil moisture meteograms also include reference lines showing the permanent wilting point (the soil moisture value at which plants cannot uptake any water) and the field capacity (the soil moisture value after excess water has drained gravitationally, usually 2 to 3 days after a rain event).
- Plant Available Water is calculated as the volumetric soil moisture minus the wilting point. It can be thought of as the amount of moisture in the soil available to be used by plants.
- The Saturation Index is calculated as the ratio between the volumetric soil moisture and the porosity, or empty volume within the soil. It is displayed in the Portal as a percentage, so a value of 80 indicates that 80% of the soil’s pore space is filled with water. In cases where the Saturation Index exceeds 100%, it may indicate that water has pooled on the ground surface and continues to infiltrate the soil. Alternatively, if the measured or estimated soil porosity (described below) is not fully representative of the soil in direct contact with the soil moisture sensor, Saturation Index values can exceed 100% for longer periods. As an example, this may arise due to non-homogenous soil conditions, i.e., if soil testing was done nearby but not directly at the same location of the soil moisture sensor, or due to changes in soil properties over time, i.e., soil settling.
The soil characteristics — specifically the wilting point, field capacity, and porosity — were determined using two different methods:
- For some stations, direct sampling and laboratory analysis was conducted as part of Weinan Pan’s Master’s thesis work at NC State. Note that this was done in 2010 or earlier, so some characteristics may have slightly changed since then.
- Other stations, mainly in western North Carolina, had their soil properties estimated using information from the Web Soil Survey.
Note that some soil parameters, particularly the volumetric soil moisture, may not be directly comparable between stations due to differences in local soil characteristics. For instance, sandy soils tend to have a lower field capacity than clay soils, so a given soil moisture value will not carry the same physical meaning between those two soil types.
Example:
With seedlings at the ready, you want to make sure the current soil moisture is sufficient for tree planting.
In the Fire Weather Portal, you find an ECONet station near your location in Asheville, NC, and view its 20-cm soil moisture data. Clicking on that station, the meteogram shows that the observed soil moisture (the blue line) has spiked in recent weeks following rain events, but the current value has been holding steady roughly halfway between the wilting point and the field capacity.
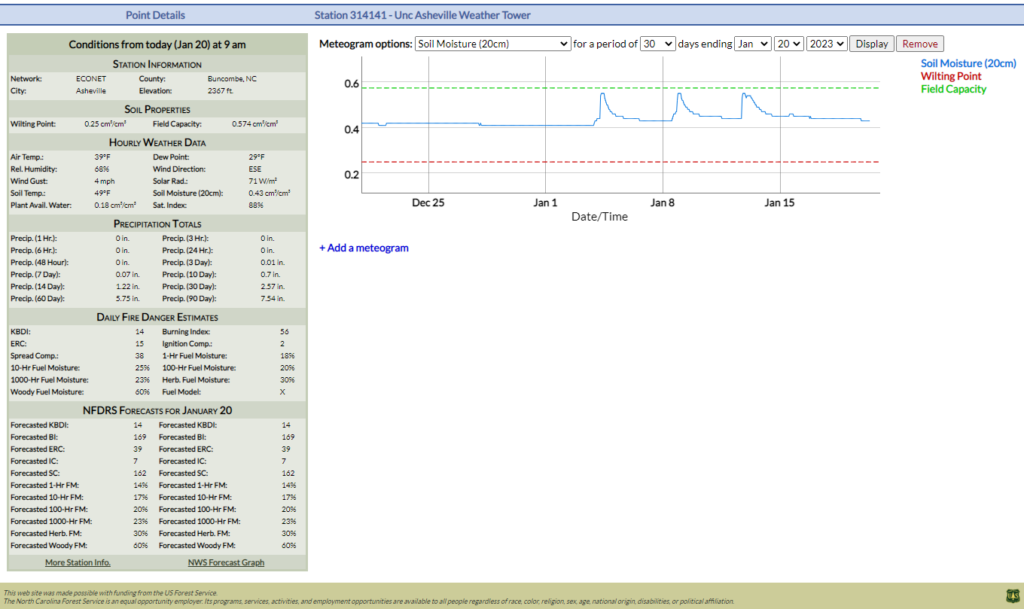
After digging into the ground and confirming that soil moisture throughout the upper root zone is sufficient, and confirming that the temperatures and relative humidity levels will not be too extreme, you decide to proceed with planting.
Fire Danger Variables
Assessing and describing the fire danger on a landscape can be challenging, even for experienced foresters. Unlike weather variables such as temperature, which can be easily measured using a single instrument, fire danger may depend on visible factors — like fuel loading on and above the ground or prevailing winds — along with less easily visible factors — such as fuel moisture and soil moisture from antecedent rainfall, or ambient humidity — and even the local terrain and time of year.
While no one measurement can capture all of these factors, the National Fire Danger Rating System (NFDRS) does include a number of parameters that more easily summarize local fire danger, and they’re all calculated using the standard elements within weather observations, including air temperature, wind speed and direction, and recent precipitation.
Every day, weather data from RAWS and NC ECONet stations feeds into the national WIMS Database, which calculates fire risk estimates from NFDRS. We download the latest estimates every afternoon and display them in the Portal. Generally, the current day’s data begin populating on or a little after 3 pm local time.
Here is an overview of the fire danger parameters available in the Portal, including standard NFDRS indicators plus a few derived variables that may aid your monitoring efforts:
- One of the most commonly used fire danger indices is the Keetch-Byram Drought Index, although as its name implies, it’s actually more of a drought indicator, as it is based on the amount and frequency of recent rainfall, along with temperatures and their inferred impact on evapotranspiration. KBDI values range from 0 to 800, which corresponds to the depth of dryness in the soil, from 0 to 8 inches. As such, KBDI doesn’t describe the risk of a fire starting on any given day, but the amount of resources that may be needed to respond if a fire does ignite.
- Note that KBDI has a built-in seasonality, with values generally lowest in the winter and highest in the summer. For that reason, a KBDI of 300 would have different meaning in January, when that amount of dryness would be highly unusual, compared to July, when evapotranspiration rates increase and more dryness is normal.
- NFDRS includes several different fuel moisture indicators. For dead fuels, their moisture content is measured in terms of time lag, or the time it takes to gain or lose moisture from the atmosphere. This lag is directly related to the fuel diameter: small fuels such as fallen pine needles have a time lag of 1 hour, while large fuels such as logs may have a time lag of 1000 hours. There are indicators for live fuels: namely, the herbaceous and woody fuel moisture. All fuel moisture parameters are displayed as a percentage, expressing the amount of moisture relative to the weight of that fuel.
- Because the fuel moisture indices are only calculated once per day, using the 1 pm observation from each weather station, the shorter time-lagged fuel moistures may not be useful during other times of day. Because of that, NC Forest Service has recommended that the 1-hour and 10-hour fuel moisture values not be displayed on the Past and Current Conditions tabs.
- The Burning Index is a fire behavior indicator describing how difficult a fire may be to control, if one ignites. It is based on a combination of the Spread Component, which is based on the wind speed and indicates the potential rate of spread of a fire, and the Energy Release Component (ERC), which is based on estimated fuel moisture and indicates the energy available to a fire. At low values, Burning Index can help justify prescribed burning, while at higher values, it can help determine how to attack an active wildfire.
- The Adjective Rating describes the local fire danger using text-based descriptors, ranging from Low to Extreme. Because of this simple interpretation, it is generally used on Smokey the Bear signs at state and national forests and parks. This rating is determined using one or more NFDRS parameters, such as ERC or 100-hour fuel moisture, with breakpoints between descriptor levels calculated using their historical climatology at a given weather station.
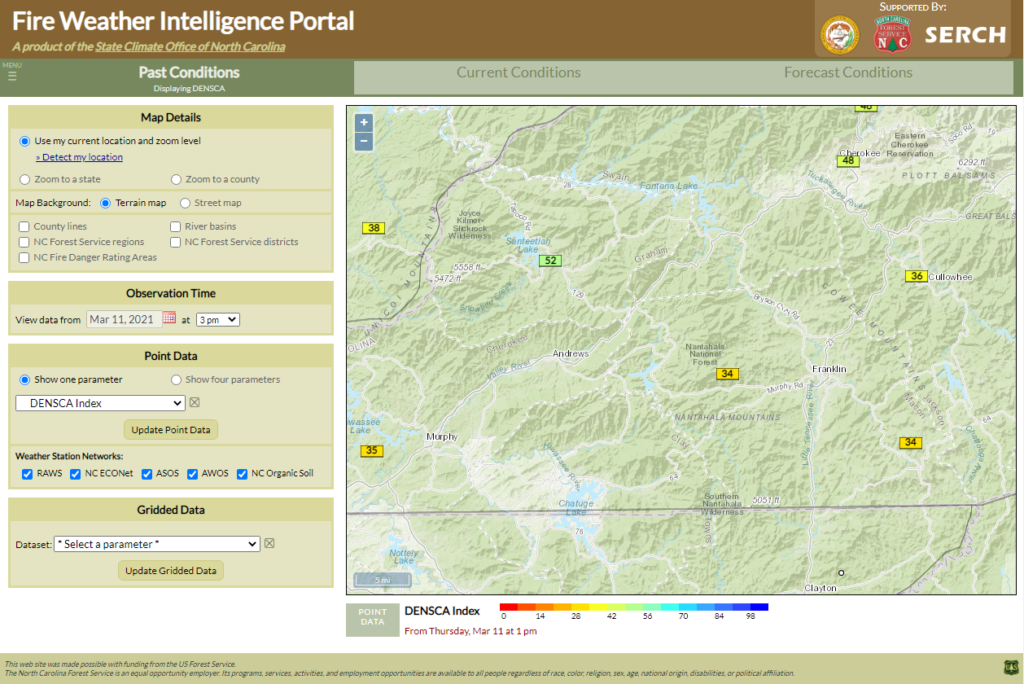
- One effort to capture fire danger in a single number is the DENSCA Index, developed by Denver Ingram and Kevin Scasny at the Southern Area Coordination Center. DENSCA combines the daily minimum relative humidity, the 100-hour and 1000-hour fuel moisture, and the ERC and Burning Index percentiles relative to the current season. Values fall along a scale between 0 and 100, and some past analyses have found that observed fire activity increases when DENSCA values drop below 35. Additional evaluation is ongoing in North Carolina.
For Past and Current Conditions, the Point Data menu also includes a section of NFDRS Forecasts for Today. These show the fire danger indices forecasted by the National Weather Service on the previous afternoon, valid at 1 pm on the selected date. These can help compare today’s estimated fire danger with what was predicted yesterday.
Example:
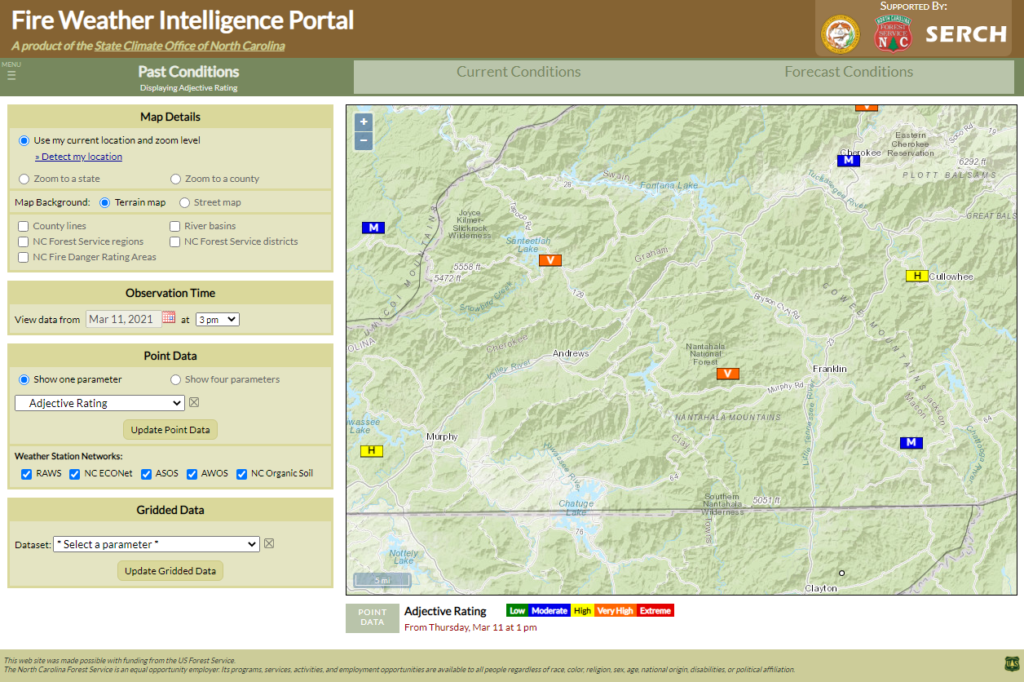
It’s mid-March, and you’ve planned a couple nights of camping at the Nantahala National Forest. However, after a few dry weeks in western North Carolina, you’re concerned about the fire danger, so you check the Portal to view the latest conditions. Knowing that KBDI may not be the best indicator to use due to its seasonality, you instead check a few other parameters.
The Adjective Rating shows “Very High” fire danger, matching what you’ve seen on the Smokey the Bear sign at the forest entrance.
This afternoon, but the 100-hour fuel moisture content is quite low, around 7%.
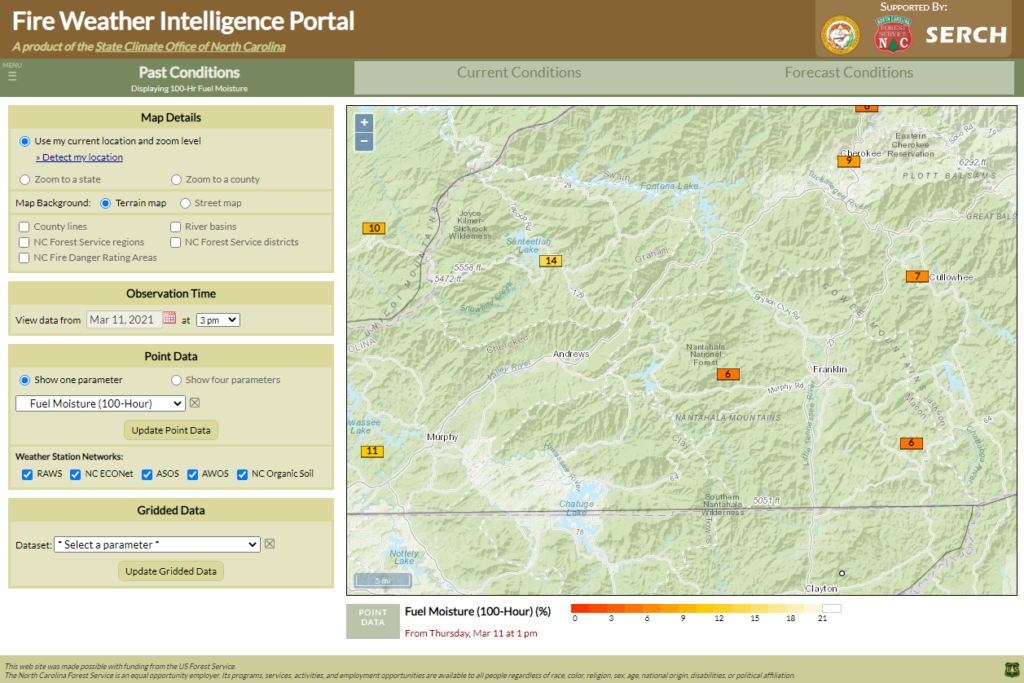
The DENSCA Index confirms your suspicious: the latest value is at 34 out of 100, which is in the range at which you know fire activity tends to increase.
Just to avoid potentially camping near any wildfires that might start, or even worse, accidentally igniting one with your camping stove, you postpone your trip to the forest.
Four-Parameter Plots
Sometimes, viewing one parameter at a time isn’t enough to capture the full picture of the environment. If you need to see additional point data information on the map, you can select the “Show four parameters” option in the Point Data menu to view up to four different datasets measured or calculated at weather stations.
Setting up this display is as easy as choosing your variables of interest in each of the four dropdown menus — the Top left, Bottom left, Top right, and Bottom right parameters. Once those are set, click the “Update Point Data” button to view these parameters on the map.
Note that at wider zoom levels, only one of these parameters will be shown at a time in order to reduce overlap on the map. You can change which parameter is shown — and is used to color-code the circle marker at each station — by clicking on its radio button in the legend beneath the map.
As you zoom in closer, all of your selected parameters will show around each marker. Note that if any of your parameters are not available at some stations, such as solar radiation or fire danger variables at ASOS/AWOS stations, no value will show in those parts of the plot for those specific stations.
Example:
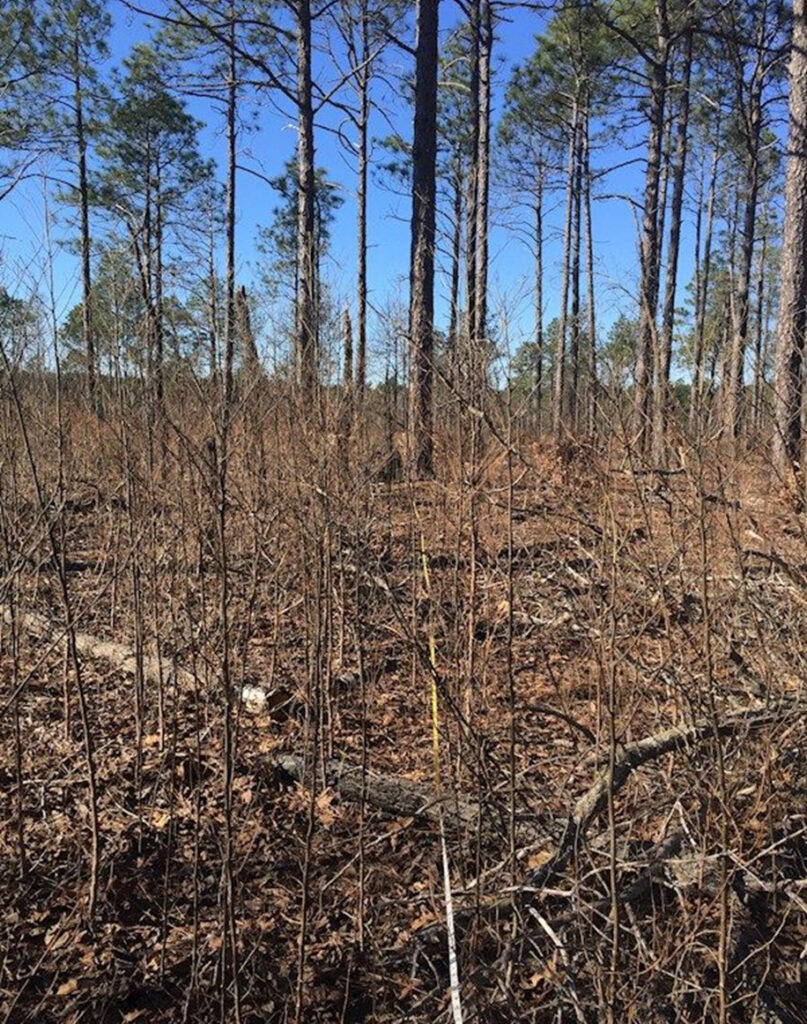
The Nature Conservancy in North Carolina noticed after a prescribed burn in January 2016 that there was significant scorching up to 6 feet deep at the burn site in the Sandhills. To investigate any potential impacts from the weather, they used the Fire Weather Portal to view a four-parameter plot of air temperature, relative humidity, wind speed, and wind direction from the time of the burn.
The weather stations in that area did not show any abnormal weather conditions, so they were able to rule out weather as a contributing factor. Upon returning to the burn site, they noticed a number of longleaf saplings with needles close to the ground, which was likely the main reason for the deep scorching.
There’s more to point data than just the numbers on the map. In the next section, we’ll look at Meteograms — a way to explore the recent weather observations and fire danger estimates from a station in much more detail.