The Portal Interface
The Fire Weather Intelligence Portal packs a lot of information into a streamlined interface, so to help guide you through this tool, let’s unpack it and navigate through the main page elements you’ll be using.
Time Period-Based Tabs
Just like your browser window might have tabs to view different web pages, the Fire Weather Portal has tabs along the top to view three different time periods upon which you may be reviewing data or making decisions:
- Past Conditions includes historical observations from the past 10+ years for some datasets. It is useful if you’re looking to investigate conditions on a historical date and time, whether it’s the weather conditions during a burn you conducted last week or the prevailing fire danger during a drought event several years ago.
- Current Conditions shows the latest observations, generally from within the past hour for weather variables or from within the past day for fire danger indicators. Having this real-time information available can help track hour-by-hour changes, such as declining daytime humidity levels or precipitation totals during a rain event, and their impact on fire danger.
- Forecast Conditions primarily features short-term forecasts over the next 1 to 7 days. This data can help you plan ahead to identify windows for prescribed burning or upcoming periods likely to have elevated fire risk.
Each tab functions like its own version of the tool. You can select different datasets and different dates on each tab, then click between them to compare conditions between those periods or solidify a plan for an upcoming burn.
Note that if you zoom or pan the map on one tab, that same location will be shown on all tabs, so you’ll always be viewing the same region.
Example:
You expect that fuel moisture levels will largely determine the success of a planned prescribed burn later this afternoon. To investigate this, you might use the three tabs in the Portal to view different datasets:
- On the Current Conditions tab, you could load the real-time Fine Fuel Moisture Content, which is calculated based on the latest hourly weather observations.
- On the Past Conditions tab, you could view that same dataset from yesterday afternoon, when you visited your burn site, to correlate these values with what you observed in the field.
- On the Forecast Conditions tab, you could display the Forecasted 1-Hr Fuels for this afternoon and compare that against the current conditions and yesterday afternoon’s fuel moisture levels.
If you noticed yesterday that fuel moisture levels were ideal for burning, and that current conditions are a bit higher than that but expected to decline throughout the day, that could give you extra confidence in having a successful burn.
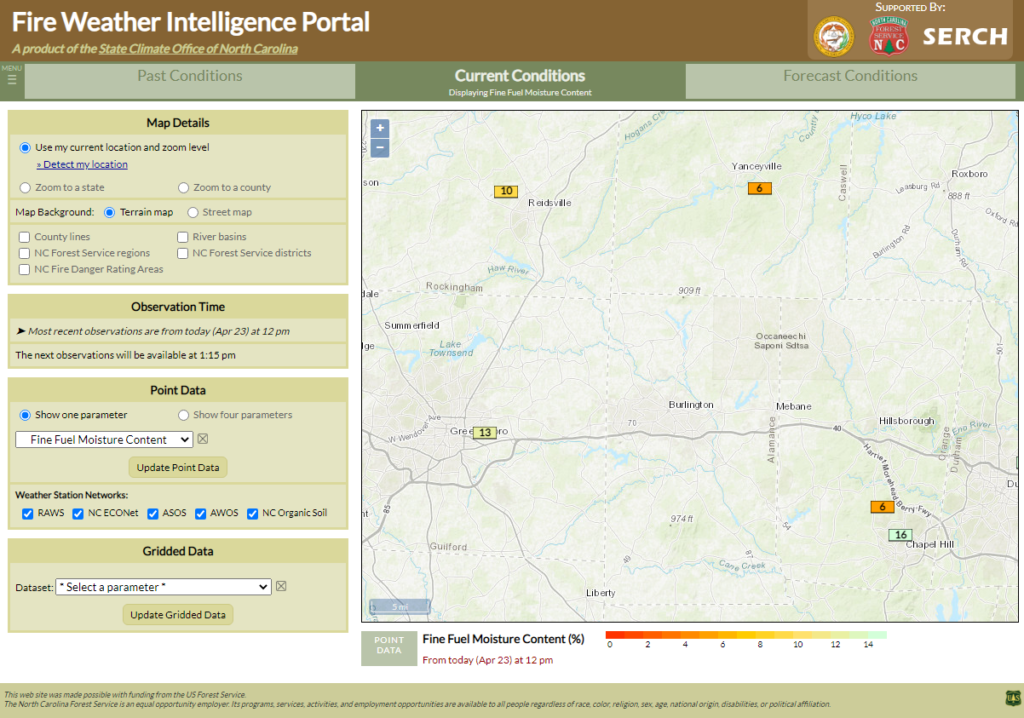
Map and Menus
Each tab includes the main map area along with menus in which you can select exactly what the map is showing. On computer screens, the menus appear to the left of the map. On smaller screens including smart phones, the menus appear above the map.
You can adjust these settings in the menus:
- In the Map Details menu, you can set exactly which region the map is focused on. To automatically zoom to your location as detected by your device, click the “Detect my location” link, if it’s available in your browser. Otherwise, you can select a state or county to center the map on one of those regions. In this menu, you can also show or hide reference layers such as county lines or river basins, which may help you find your location on the map or identify key features nearby.
- The Observation Time menu will display and help you set which date/time you’re viewing. It is most useful on the Past Conditions tab to specify exactly which historical period you want to view. For some weather stations and datasets, this past data goes back as far as 2002.
- The Point Data menu lets you select a point-based dataset to view. These include hourly observations from reporting weather stations and fire danger estimates derived from that weather data. For more on the available point data, view the Point Datasets section of the user guide.
- The Gridded Data menu lets you choose gridded or other spatially continuous (i.e., not from individual points or weather stations) products, such as precipitation estimates and high-resolution weather analyses. These will appear in the background on the map, behind any point datasets you select. For more on the available gridded data, view the Gridded Datasets and Forecast Products sections of the user guide.
The map itself functions just like a Google Map or other web-based map tools. To change your location, you can zoom in or out by double-clicking/tapping, using your mouse scroll wheel, or using the + and – icons, and pan by dragging across the map.
Just below the map, you’ll see legends for all of the selected datasets. These include useful information such as the color ramp, the data source, the date/time on which the observations or data are valid, and for forecast products, the date/time when the forecast was issued.
Example:
You just moved onto a new plot of land and want to orient yourself with the surroundings and any nearby weather stations that could help you plan prescribed burns in the future. In the Portal, you could assess that by changing these menu options:
- Under Map Details, click “Detect my location”, or select your state and county. Make sure the Terrain map is selected, and that County lines are turned on.
- Under Point Data, select the Keetch-Byram Drought Index and click the “Update Point Data” button.
Even this simple map view may reveal some interesting characteristics about your new area. On the terrain map layer, do you see any features such as nearby hills or rivers? If you toggle back to the Street map view, do you see any major roads nearby that you’ll want to avoid covering in smoke? And are there any local weather stations that have fire danger estimates such as KBDI? If so, roughly how far away are they, and are there any terrain differences in those areas?
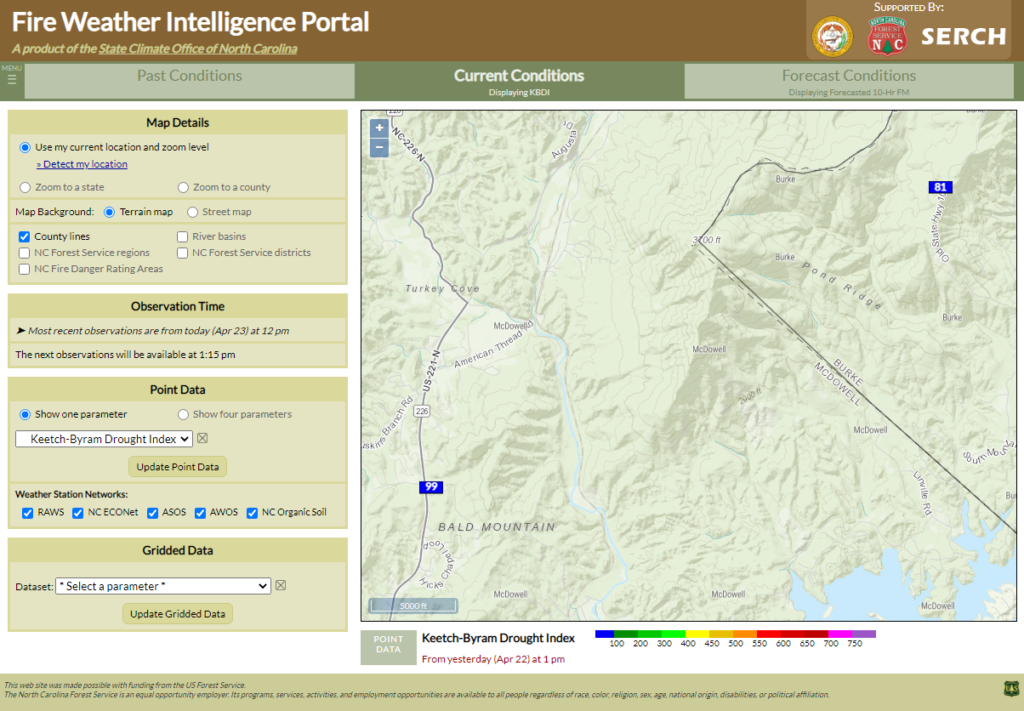
In this case, you notice two nearby stations with fire danger data, separated by a mountain ridge. The legend shows you that the current KBDI values are from yesterday afternoon, so you’ll need to check back in a few hours to get today’s fire danger estimates.
Top Menu and Bookmark Option
By aggregating data from multiple states, time periods, and sources, the Fire Weather Portal is designed to be a time-saver when monitoring environmental conditions. You can find a few additional helpful features in the top menu, which you can expand by clicking on the “MENU” hamburger icon (☰) to the left of the three tabs.
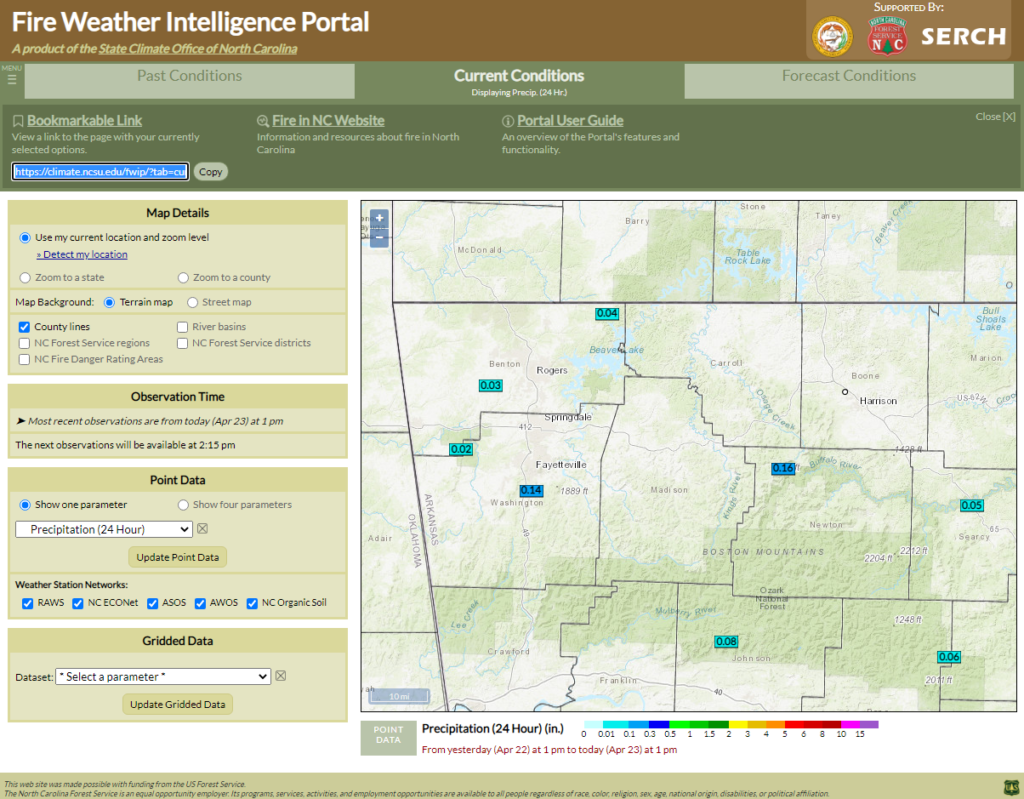
This menu includes links to the Fire in North Carolina website and this user guide, which may contain useful additional information as you’re browsing the Portal. One other option may be especially useful: the Bookmarkable Link.
If you have a particular region or zoom location on the map that you like to view, and specific datasets in the Past, Current, and/or Forecast Conditions time period tabs, you can simply display these once on the Portal, then copy this bookmarkable link and save it so the Portal will automatically open on this exact view whenever you access that link in the future.
Example:
To help maintain situational awareness throughout the year, you’d like to check precipitation totals from nearby weather stations in the Fire Weather Portal every day. After selecting Precipitation (24 Hour) in the Point Data menu and zooming the map to your location, you can open the top menu and click the “Copy” button under the Bookmarkable Link option. This link will load that same map view — the latest 24-hour precipitation totals for your selected location.
Now that you know your way around the Portal, let’s see more of the available Point Datasets you can view on the map.