Forecast Products
Over the ten years since the Fire Weather Portal development work initially began, one of the biggest changes has been the availability of more and better forecast guidance. Thanks especially to the work of the National Weather Service, we now have longer-running point-based fire danger forecasts, more detailed county- and zone-based fire weather forecasts, and higher-resolution gridded model forecasts, all of which can give you more resources to consult and more confidence when dealing with fire danger or planning a prescribed burn.
This guide covers the forecast products currently available in the Portal, which may continue to expand in the future as new datasets become available.
Point Data
National Weather Service offices across the Southeast region automatically generate fire danger forecasts for RAWS-standard weather stations in their county warning areas. New forecasts are created each afternoon or evening, once the daily 1 pm weather station observations are pushed to WIMS. Historically, only the next day’s forecast was included, but in early 2020, NWS offices began producing 7-day NFDRS forecasts.
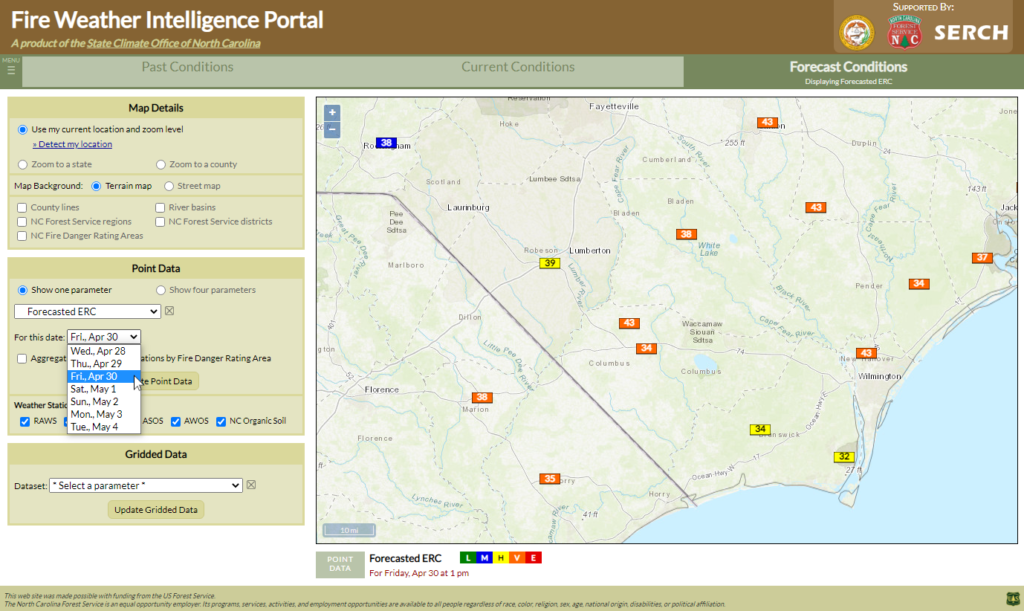
The standard NFDRS variables are available in these forecasts, and you can select them from the Forecast Conditions tab under the Point Data menu. This includes forecasted KBDI, Burning Index and its components, Spread Component and ERC, the Ignition Component, dead fuel moisture content at time lags ranging from 1 to 1000 hours, and live herbaceous and woody fuel moisture content.
After selecting a parameter, you’ll see a few additional options appear within the Point Data menu. First, you can select your forecast date of interest using the “For this date:” dropdown menu. And if you’re in North Carolina, you may want to view the data aggregated by Fire Danger Rating Area, which are regions of the state with similar terrain, vegetation, and climate, and include a set of representative weather stations curated by the NC Forest Service.
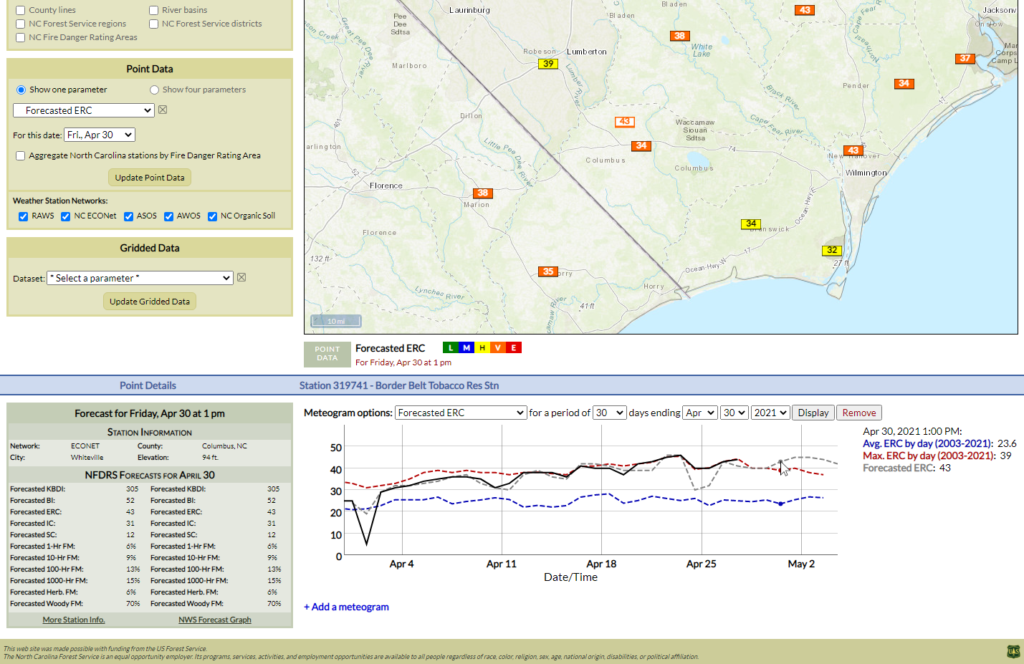
Once you’re viewing data on the map, you can view a meteogram for any station by clicking on it. Meteograms for forecasted fire danger parameters show past one-day forecasts and the current 7-day forecasts as a gray dashed line. This can be a useful indicator of how well the forecasts have performed compared to the actual daily estimates (the solid black line), which are calculated using the observed weather conditions.
Example:
A recent string of warm, dry days has seen steadily increasing fire danger across southeastern North Carolina. You use the Portal to check forecasted conditions for later this week.
On the Forecast Conditions tab, you load Forecasted ERC, and in the date dropdown, you select this Friday. After clicking “Update Point Data”, those forecasts load on the map.
Clicking on one station in Whiteville, NC, you look at its meteogram and see that recent forecasts have generally matched closely with the daily estimates. By Friday, April 30, you see that Forecasted ERC values are expected to exceed the historical maximum values for that day of the year, based on records dating back to 2003.
NWS Gridded Forecasts
As part of their routine forecasting responsibilities, National Weather Service offices across the country produce gridded weather forecasts at a 2.5 km (1.6 mile) resolution, which feed into the National Digital Forecast Database, which gives a mosaic of forecasted conditions from all offices. As such, these gridded forecasts can sometimes look like a bit of a patchwork if, for instance, one office is expecting warmer afternoon temperatures than its neighbors, but offices generally collaborate to present as seamless of a forecast as possible.
A number of key weather variables are available in the Portal, including Air Temperature, Dew Point, Relative Humidity, Wind Speed, and Cloud Cover. You can access them on the Forecast Conditions tab in the Gridded Data menu under the “NWS Gridded Forecasts” heading.
After selecting a dataset, you’ll see a date/time selection option within the Gridded Data menu. Forecasts are generally available every hour for the first 36 hours, then every 3 hours out to 60 hours, and every 6 hours up to six and a half days away from the current time.
NWS offices also produce certain key fire and smoke variables, although these are not currently part of the national database. However, many of the offices covering North Carolina have made these grids for their county warning areas available to us for display in the Portal. Under the heading “NWS Gridded Fire Products for NC”, this data includes Ventilation Rate, Pasquill-Turner Stability Class, Atmospheric Dispersion Index, and Low Visibility Occurrence Risk Index. (More information about several of these parameters is included in the section below.)
These gridded fire forecasts are generally available on an hourly basis up to 48 hours away from the current time.
Example:
You’re hopeful of fitting in a prescribed burn this weekend, and the initial weather forecast you’ve seen on the news shows potentially favorable conditions. To investigate further, you check the forecasts in the Fire Weather Intelligence Portal.
Along with the point-based Forecasted 10-Hour Fuel Moisture, you load the gridded Relative Humidity product from the NWS.
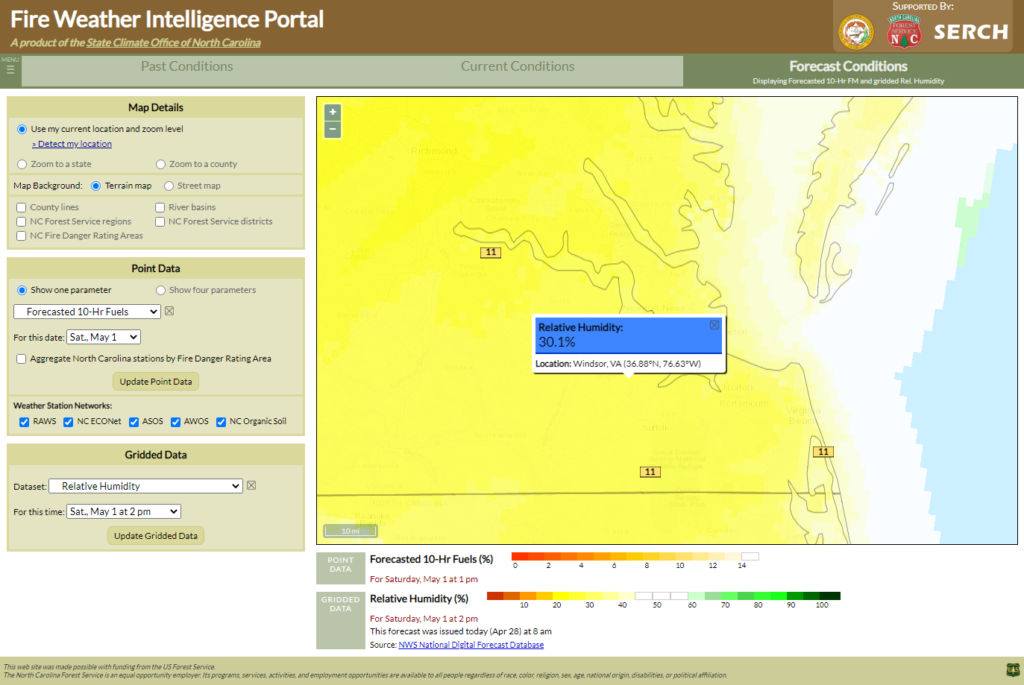
Both of these show that conditions may be a bit to dry for any safe burning. With fuel moisture content of around 11% across the Tidewater region of Virginia, and local relative humidity values of around 30% by mid-afternoon on Saturday.
National Blend of Models Forecasts
The number of weather forecasting computer models continues to increase, and checking each of them isn’t practical or timely. To help consolidate these into a single product, the National Weather Service has developed the National Blend of Models (NBM), a high-resolution composite of various forecast models that aims to provide a skillful model consensus as guidance for NWS forecasters and other users.
Using NBM forecasts, the NC State Climate Office has calculated a number of key fire and smoke variables, which are viewable in the Portal:
- The raw NBM forecasts include a measure called mixed layer depth, more commonly known as Mixing Height. This is defined as the height above ground level through which smoke is dispersed by atmospheric processes such as turbulent mixing, or the overturning of air. Burning is often discouraged when the mixing height is less than 1,500 to 2,000 feet, and any residual smoke under these conditions may become trapped near the ground. In NBM, the mixing height is calculated using the Stull method.
- The Transport Wind Speed is the average wind speed between the surface and the mixing height above a given point. Prescribed burning is generally discouraged with transport wind speeds of less than 10 mph.
- Multiplying the mixing height by the transport wind speed gives a measure called the Ventilation Rate. This is the basis for another parameter, the Burning Category. Some southeastern states including North Carolina used this as a guideline for prescribed burning. Note that each state may have different breakpoints and interpretations for each category, so consult with your local state forestry service for more information about how to use Burning Category in your area.
- Another important consideration when burning is the atmospheric stability, and it is categorized by the Pasquill-Turner Stability Class. Calculated using a combination of wind speed and solar radiation or cloud cover information, these stability classes are often linked with anticipated fire behavior. A daytime class of 1 or 2 means conditions are extremely or moderately unstable, which may cause fires to burn erratically or unpredictably. Slightly unstable to neutral conditions are often preferred, while stable conditions overnight may be associated with low mixing heights and/or temperature inversions that could trap smoke near the ground.
- The Atmospheric Dispersion Index (ADI) is a key indicator calculated using the mixing height and stability class. Overall, it provides a measure of how well smoke will disperse throughout the atmosphere. Some states use ADI instead of Burning Category in their guidelines, although neither parameter should be solely relied upon to make go or no-go burning decisions. Generally, daytime ADI values above 60 are preferred for prescribed burning, although values above 100 may indicate unpredictable conditions with potential fire control issues.
- The ADI and surface relative humidity can be used to calculate the Low Visibility Occurrence Risk Index, or LVORI. It is categorized based on historical automobile accident reports associated with reduced ground-level visibility. Use extra caution when burning if nighttime LVORI values are 8 or higher, if persistent overnight smoldering is expected, or if your burn site is connected to a roadway by an opening such as an open field or logging road.
With these parameters available, the NBM can be an ideal source of information about atmospheric conditions that can help you formulate a prescribed burn plan, such as checking the potential timing of inversion burn-off or onset, or viewing detailed dispersion or low visibility risk forecasts for your area. There is one important limitation to note, though. Since the NBM averages a number of different models, it does tend to blur localized weather features such as the temperature gradient along a cold front. In those situations, you may still need to consult with your local NWS office about the exact timing and intensity of such events.
Example:
How long might your burning window be open before any lingering smoke is trapped near the ground? You turn to the Portal to view high-resolution Mixing Height from the National Blend of Models for your location in eastern Kentucky.
After checking several different hours throughout the day, you see that by 6 pm, mixing heights are forecasted to remain near 7,000 feet above ground level, which should provide sufficient dispersion.
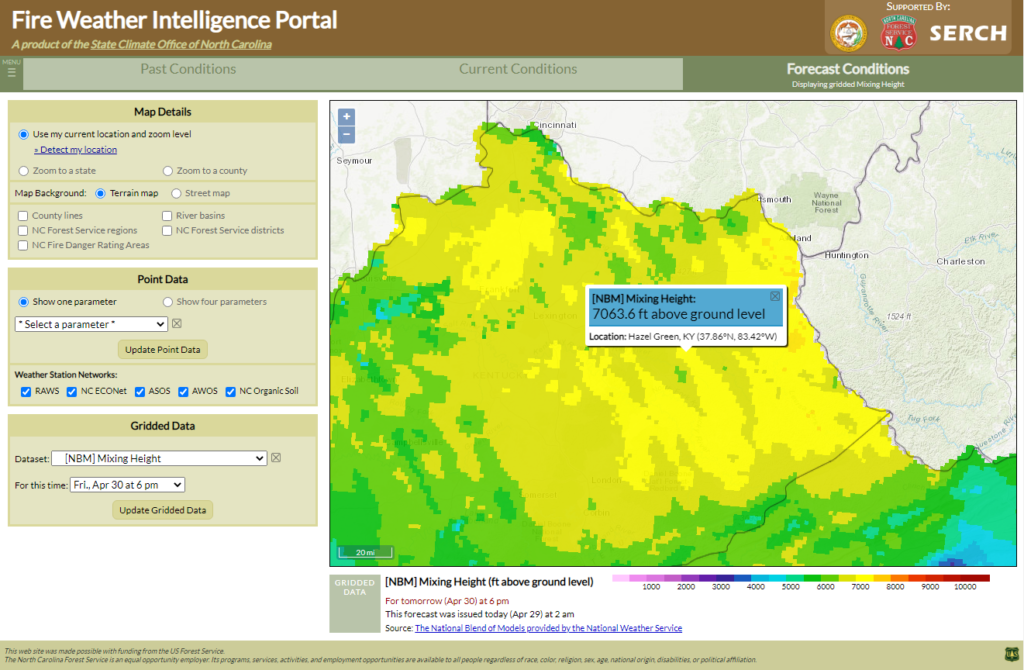
By 7 pm, though, this forecast shows mixing heights crashing to less than 2,000 feet after sunset.
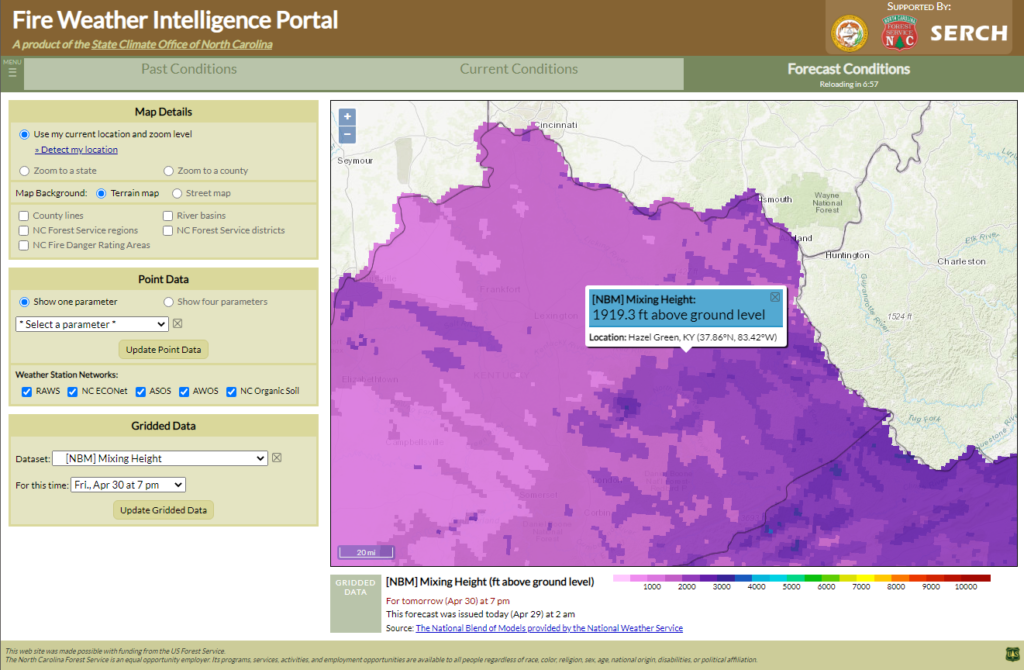
Since you anticipate some minor smoldering toward the end of your prescribed burn, you decide to finish burning a few hours early, around 4 pm, to make sure there are no issues with low-level smoke overnight.
You also determine to check back before your burn starts tomorrow morning to see if the forecast has changed.
NWS Fire Weather Zone Forecasts
The National Weather Service also produces forecasts of key fire and smoke parameters for counties and similar geographical regions, such as the high-elevation areas within a county. These Fire Weather Zone forecasts are generally issued twice per day and cover the next 1 to 2 days.
Standard parameters included in these forecasts are Burning Category (using state-specific breakpoints, where available), Mixing Height, Transport Winds, and Pasquill-Turner Stability Class. Most NWS offices also forecast the Atmospheric Dispersion Index, although it may be alternately presented as a single daytime value or two values representing the early and late-day conditions. Some offices also forecast the maximum Low Visibility Occurrence Risk Index. When viewing any of these parameters on the map, you can click on any zone to view the full forecast, including its issuance time.
While these zone forecasts don’t offer the same high-resolution localized detail or hour-by-hour guidance as the gridded forecasts described above, they can still be a useful starting point to assess environmental conditions, especially for prescribed burning. From there, you can follow up with your local NWS office for additional guidance, such as submitting spot forecasts as described in our Portal in Action user guide section.
Example:
Could tomorrow be a potential opportunity for burning in northern Alabama? You check the Portal to see the latest Fire Weather Zone forecasts for your area.
In the Gridded Data menu, you select Atmospheric Dispersion Index (Daytime) and tomorrow’s date. Clicking on your county, you can see the full details of that forecast.
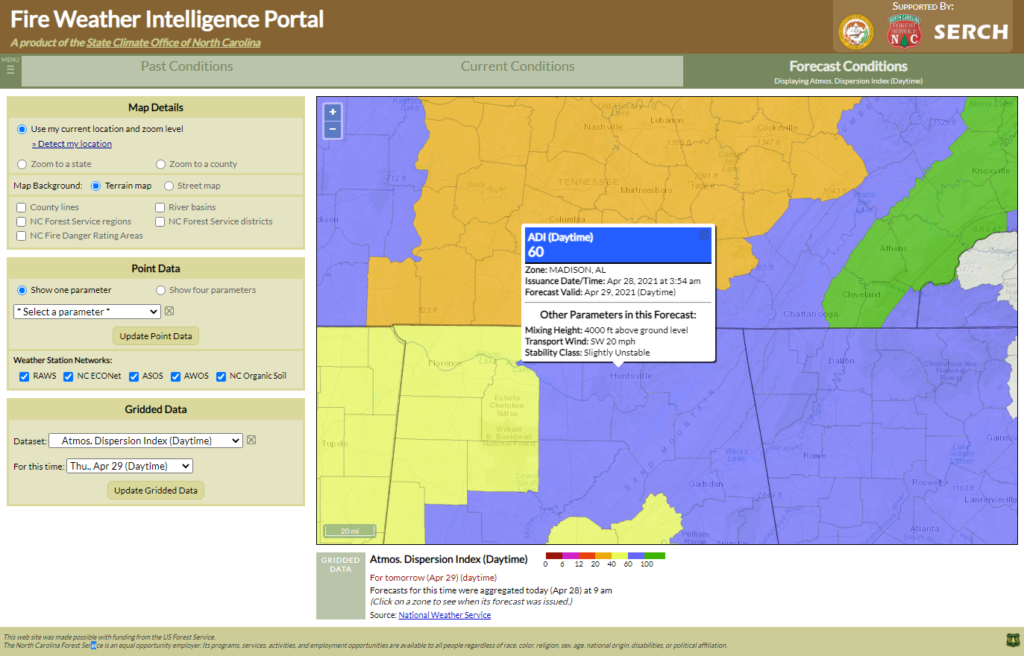
The forecasted ADI of 60 is classified as “Generally Good”, and the mixing height and transport winds seem sufficiently high for burning. Given your location north of Huntsville, the southwesterly wind direction should also avoid carrying any smoke toward the city.
Based on this information, you submit a spot forecast with your local NWS office, providing them more information about your burn and getting a customized forecast for your exact location.
CPC and WPC Outlooks
The National Weather Service’s Climate Prediction Center and Weather Prediction Center both issue outlooks that can be useful for planning days, weeks, and even months in advance. These outlooks aren’t gridded, but rather highlight swaths of the country based on their odds of having certain conditions or precipitation amounts.
The Climate Prediction Center issues temperature and precipitation outlooks ranging from the next 6 to 10 days up to seasonal outlooks from one to six months out. These outlooks do not show how warm, cool, wet, or dry certain regions might be, but rather, they show the odds of having temperatures or precipitation above or below normal.
Usage Tip:
It’s easy for even meteorologists to misinterpret the CPC outlooks. For instance, if it shows a 33 to 40% probability of having above-normal temperatures over the next 8 to 14 days, you might hear people interpret it as “it’s likely to be warmer over that time period”.
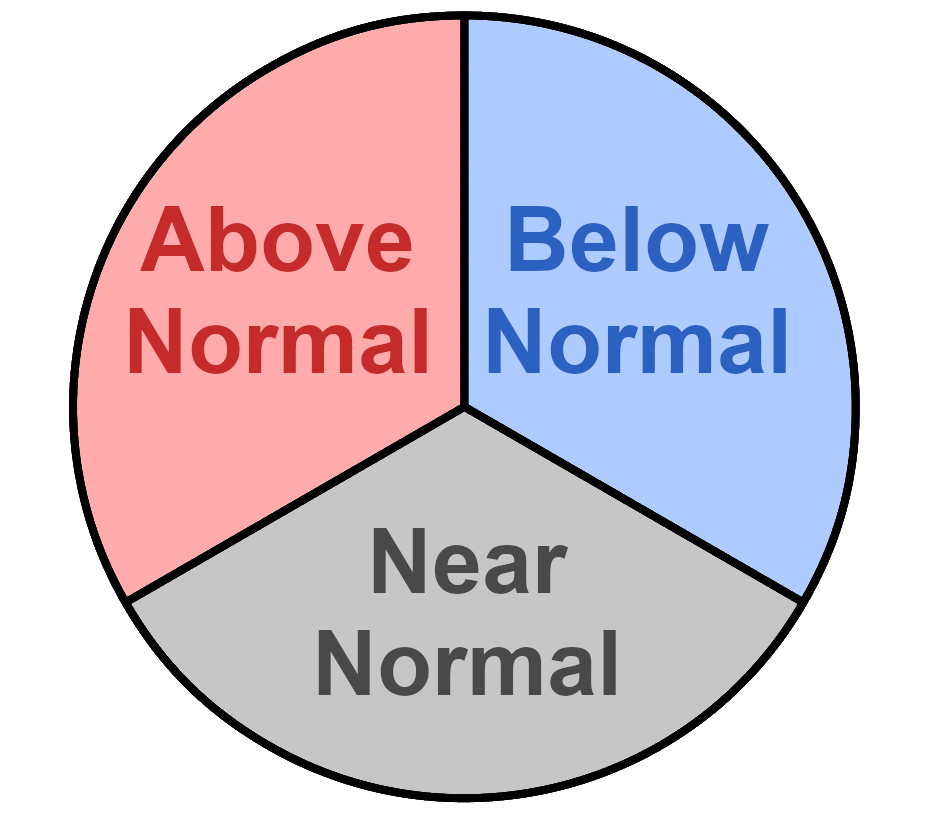
However, that’s not exactly correct. While this probability does represent elevated odds of above-normal temperatures, remember that’s only one possible scenario: the CPC splits potential conditions into above-normal, near-normal, and below-normal, each of which has historically occurred 33% of the time. So even a 40% of chance of above-normal conditions means there is still a 60% chance of near-normal or below-normal conditions. Once these probabilities exceed 50%, it then becomes accurate to describe them as likely.
Similarly, if your region is not shown with elevated odds of either above-normal or below-normal conditions, that does not necessarily mean that conditions will be near-normal. Instead, it simply tells you that the current guidance does not offer any strong indications about which way the weather might lean during this time. The CPC refers to this as equal chances of above-normal, near-normal, or below-normal conditions. You can think of this like throwing darts at a dartboard; a random throw should have a one-in-three chance of hitting any of the three pie piece-shaped wedges on the board, as illustrated in the chart above.
The CPC also issues monthly and seasonal drought outlook. These use a combination of the current US Drought Monitor boundaries and the precipitation outlook over the next 1 to 3 months to identify areas where drought may be expected to intensify or improve.
The Weather Prediction Center provides much shorter-term precipitation forecasts over the next 1 to 7 days. These are created from a combination of computer model guidance to highlight areas where precipitation may be expected, and the amounts that may fall in those areas, generally given as a range of values such as “0.10 to 0.25 inches”. These precipitation outlooks can be viewed day-by-day or over a range of days by changing the “For this period” option in the Gridded Data menu.
Example:
The final stages of springtime green-up have slowed down across central Georgia, and you’re wondering whether any rain might be coming soon or if more dry weather is likely. The CPC and WPC outlooks in the Portal can help you check this.
First, you view the Weather Prediction Center’s precipitation forecast for Days 1-7 by selecting that menu option. This shows only 0.01 inches of rain forecasted for your area.
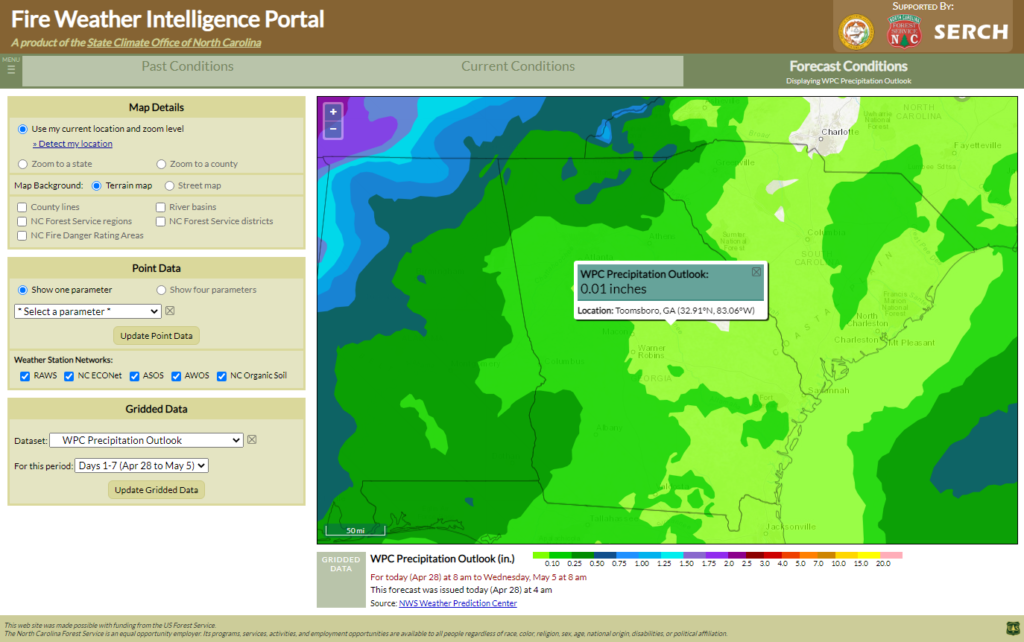
You then view the Climate Prediction Center’s precipitation outlook over the Next 8 to 14 days. It shows much of the Southeast US with a 33 to 40% chance of below-normal precipitation.
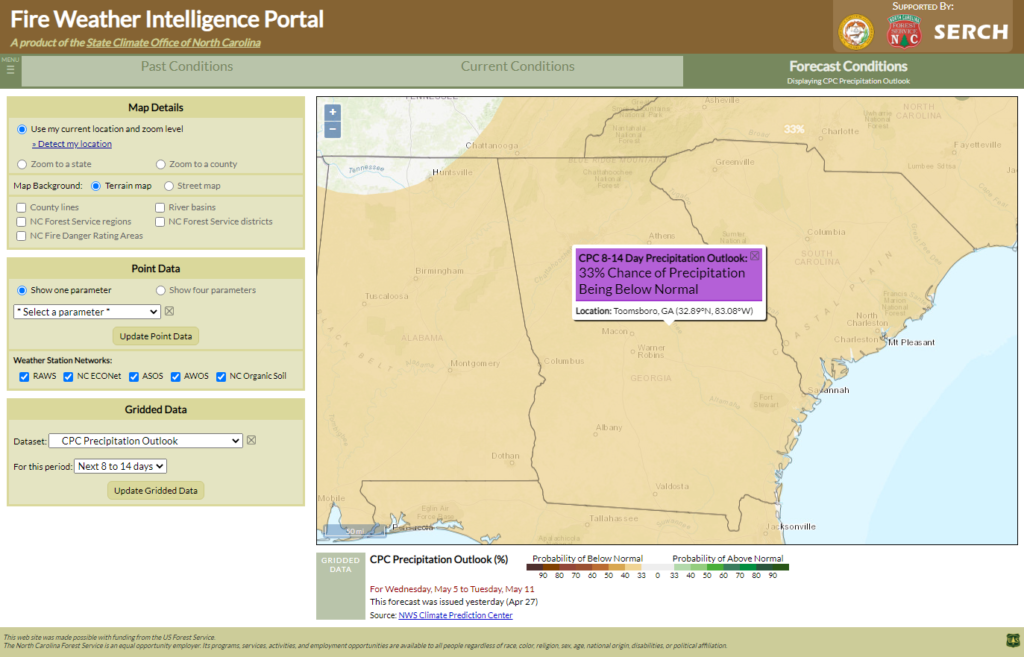
You’re tempted to tell a colleague that “it’s likely to be dry”, but remembering how the CPC outlooks are constructed, you instead tell them that “rainfall should be very limited over the next 7 days, and after that, we’ve got a little better chances of being dry than wet based on the current forecasts”.
At this point in the user guide, we have covered all of the key features and datasets in the Fire Weather Intelligence Portal. To bring it all together, let’s wrap up with an example of the Portal in Action — a walkthrough of how you can use the Portal, along with other National Weather Service products and forecasts, to prepare for a prescribed burn.