As its name implies, it’s a change five years in the making, and it has finally taken place. As the NFDRS2016 system is adopted by more states across the country, we have finally made the transition with our Fire Weather Intelligence Portal.
In our regional real-time monitoring tool, all fire danger estimates and forecasts will use NFDRS2016 data for dates on or after October 1, 2021. That means Current and Forecast conditions will now always show NFDRS2016 data for stations that have adopted the new fuel models. Based on the background behind this new system and analysis that has already taken place, this represents a big step forward for fire danger monitoring.
About NFDRS2016
The NFDRS2016 system channels fire science and research from the past 40 years to offer several main improvements to fire danger estimates:
- The need for seasonal editing of stations in WIMS has been removed thanks to the implementation of the Growing Season Index, which uses weather data to model plant phenology changes such as green-up.
- The Nelson dead fuel moisture models use fuel energy balance and capillary water transport equations to more accurately simulate diurnal and seasonal moisture changes, and they don’t require knowing the “State of the Weather”.
- The 20 fuel models from NFDRS1978 have been simplified into just five models corresponding to predominant fuel types, including model X (brush) and model Z (slash), which are common across the Southeast US.
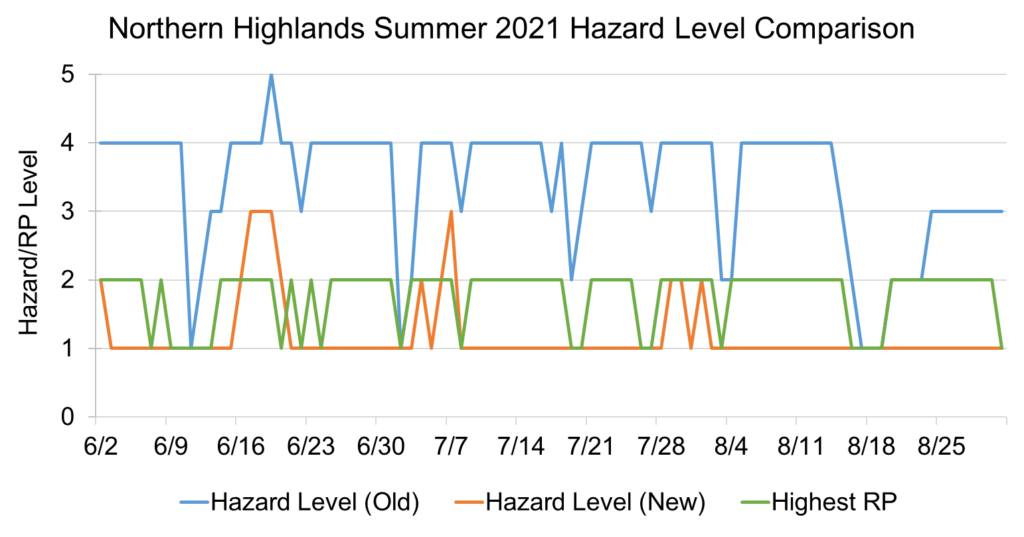
Over the past year, the North Carolina Forest Service has been evaluating NFDRS2016 alongside the old system, and the results are extremely encouraging. Recently, they reviewed the daily hazard level — an indicator ranging from 1 to 5 based on how current fire danger compares to historical conditions — calculated using both systems for their multi-county Fire Danger Rating Areas across the state.
During summer 2021, the hazard level calculated using NFDRS2016 was within one decision class of the highest district readiness plan level more than 90% of the time. For some FDRAs, the hazard levels calculated using NFDRS1978 data were within one class as little as 12% of the time, representing a marked improvement for the new system.
Accessing the New Data
With a more accurate and more automated system for estimating fire danger now available, we’re excited to share that information across this website. Here are some of the changes you may notice in how and where data is displayed:
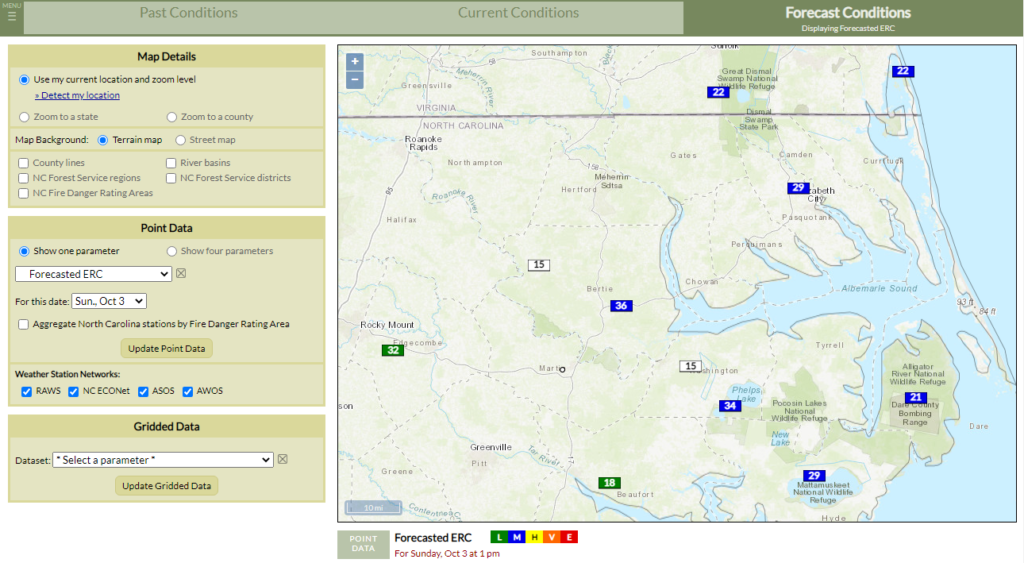
- On the homepage of this Fire website, the map of Adjective Rating aggregated over North Carolina FDRAs now uses NFDRS2016 data. The Sandhills uses fuel model Z, while all other Fire Danger Rating Areas use fuel model X.
- Our Station Status tool has been given an overhaul, and it now includes a map interface to quickly view how recently stations across the region have reported weather observations or have NFDRS2016 estimates available. Also including the familiar table layout of recent observations, this tool remains an ideal way to check which stations near you are reliably reporting data.
- In the Fire Weather Intelligence Portal, data beginning on October 1, 2021, will use the highest-priority NFDRS2016 fuel model for each station, as configured in WIMS. Prior to this date, data from the old 1978/88 systems will still be shown, but with added disclaimers to the maps and meteograms, as shown below.
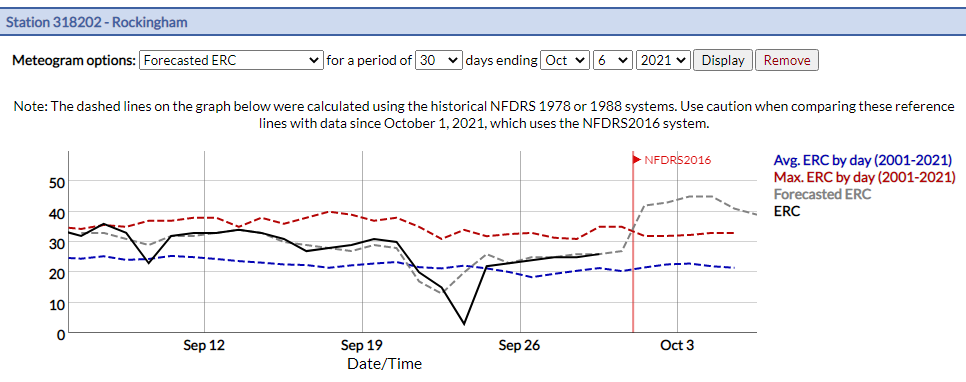
While this implementation of NFDRS2016 into our fire data tools represents the biggest part of the transition, it isn’t quite finished just yet. References calculated using the old system, including the historical daily maximum, minimum, and average lines on the meteograms, will need to be updated once a sufficient amount of data is calculated using the new NFDRS2016 system. We hope to generate and update these metrics in the months ahead.
The same applies to updating pocket cards and other reference materials, which should be done by individual state forestry agencies. Additional analysis and comparisons of the old and new systems is sure to come as well, but the results so far are promising as we enter the next generation of fire danger monitoring.