October According to the ECONet
Over the past month, we’ve been in the field nearly every day visiting our ECONet weather stations for some final fall maintenance. With our statewide network on our minds, this month’s climate summary will look at October through the lens of the ECONet.
About the ECONet
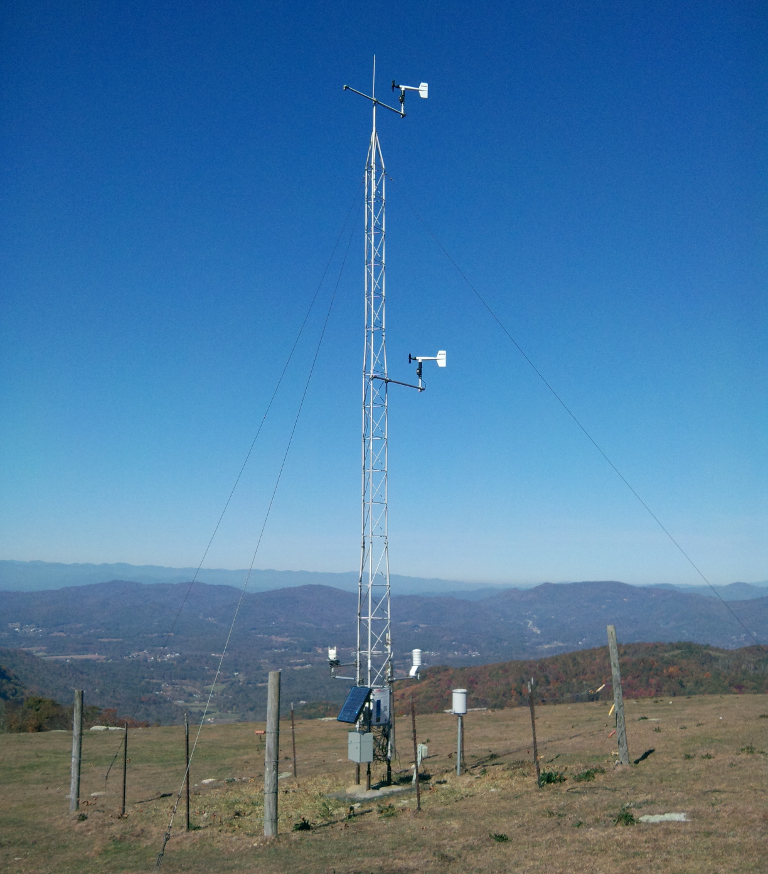
If you’re not familiar with our network, here’s a refresher. We manage 39 weather stations across North Carolina plus one on the South Carolina border atop Sassafras Mountain. Our network stretches from the far western mountains to the sand dunes along the coast. These stations are located at research farms, schools, utilities, and other sites, depending on local availability and the group funding the station.
Each station consists of a 10-meter (or roughly 33-foot) tower covered with sensors that measure standard weather variables — temperature, precipitation, winds, and the like — as well as parameters such as solar radiation, soil moisture and temperature, and leaf wetness that help folks like farmers make well-informed decisions related to their local weather and climate.
This data also gives us a unique perspective about statewide conditions, like we saw with the drop in solar radiation during the solar eclipse in August. In October, our ECONet also showed us just how variable conditions were across the state and throughout the month.
Tumbling Temperatures
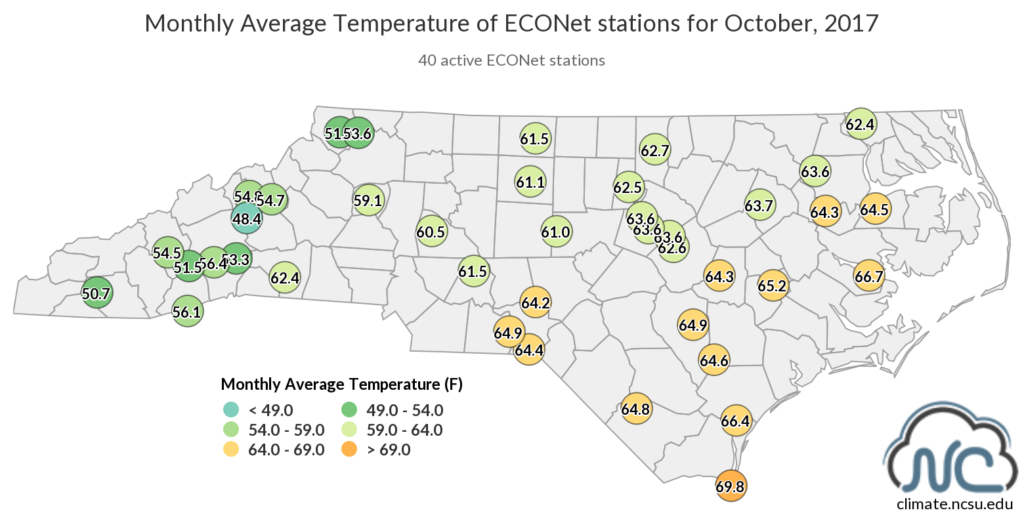
Across our 40 ECONet stations, last month’s average temperature was 60.76°F. For comparison, the statewide average across all National Weather Service Cooperative Observer stations was a bit higher at 62.13°F, ranking as the 19th-warmest October in the past 123 years. The difference between the two averages comes down to elevation, as 10 of our stations — one quarter of the network — are located above a half-mile in altitude!
Perhaps the most notable feature of our October temperatures was the variability from hot days early in the months to cool nights by the end. Our Hamlet tower in the Sandhills peaked at 92.1°F on October 9, and four other stations had a monthly high temperature of at or above 90°F. You can see last month’s average temperatures on the map below.
Later in the month, though, the chill was real as low temperatures dropped into the 30s, bringing fall’s first frost in some areas. A few spots even saw the season’s first accumulating snow. Beech Mountain picked up 1 inch of snow on October 30, while Mount Mitchell received a half-inch on the same day as temperatures bottomed out at 15.4°F.
Those big differences in air temperatures drove some substantial soil temperature variations as well. Eight of our stations reported both their warmest ever October soil temperature and their coolest ever October soil temperature, and the differences were fairly large. At our Sandhills station in Jackson Springs, the difference between the highest soil temperature (86.5°F) and the lowest soil temperature (44.8°F) was a whopping 41.7 degrees!
A Wet Month in the West
On average, it was a wet October at our ECONet sites, with an average precipitation of 5.85 inches. The statewide average precipitation from the broader Cooperative Observer network was similar at 5.40 inches, ranking as the 15th-wettest October since 1895.
The ECONet average was again slightly different due to the greater concentration of those stations in the Mountains, where October was particularly wet. Mount Mitchell received 17.35 inches of precipitation — the wettest October there since records began in 1980.
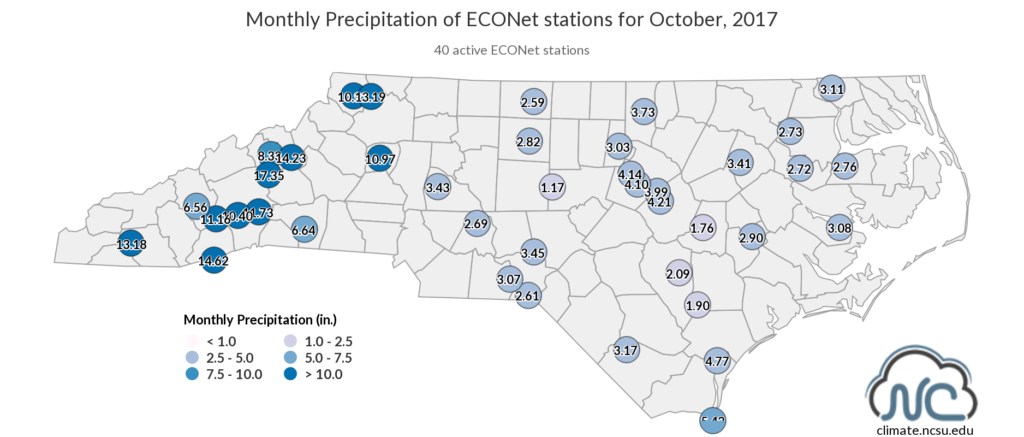
While Mountain sites received well above-normal precipitation for the month, many Piedmont and Coastal Plain sites were on the dry side. Our Siler City station received just 1.17 inches of rain — the fourth straight month with less than half its normal rainfall. Our stations in Goldsboro (1.76 inches) and Wallace (1.90 inches) also received less than two inches of rain last month.
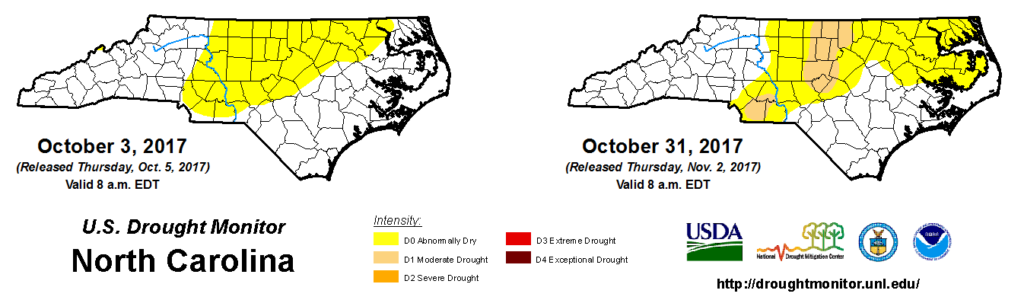
The ongoing dry conditions across the Piedmont means that Moderate Drought conditions were introduced in some areas, while Abnormally Dry conditions expanded into the northeastern Coastal Plain in October.
With the growing season coming to a close, the primary impact of the recent dryness has been to reservoir levels. According to the Army Corps of Engineers, Kerr Lake, Falls Lake, and Jordan Lake are all more than two feet below their target levels.
If you live in the areas currently experiencing Moderate Drought or Abnormally Dry Conditions, now is a good time to think about checking for leaks and minimizing nonessential water use. You can also visit the NC Drought Management Advisory Council’s website to stay informed on drought conditions and advisories for you area.
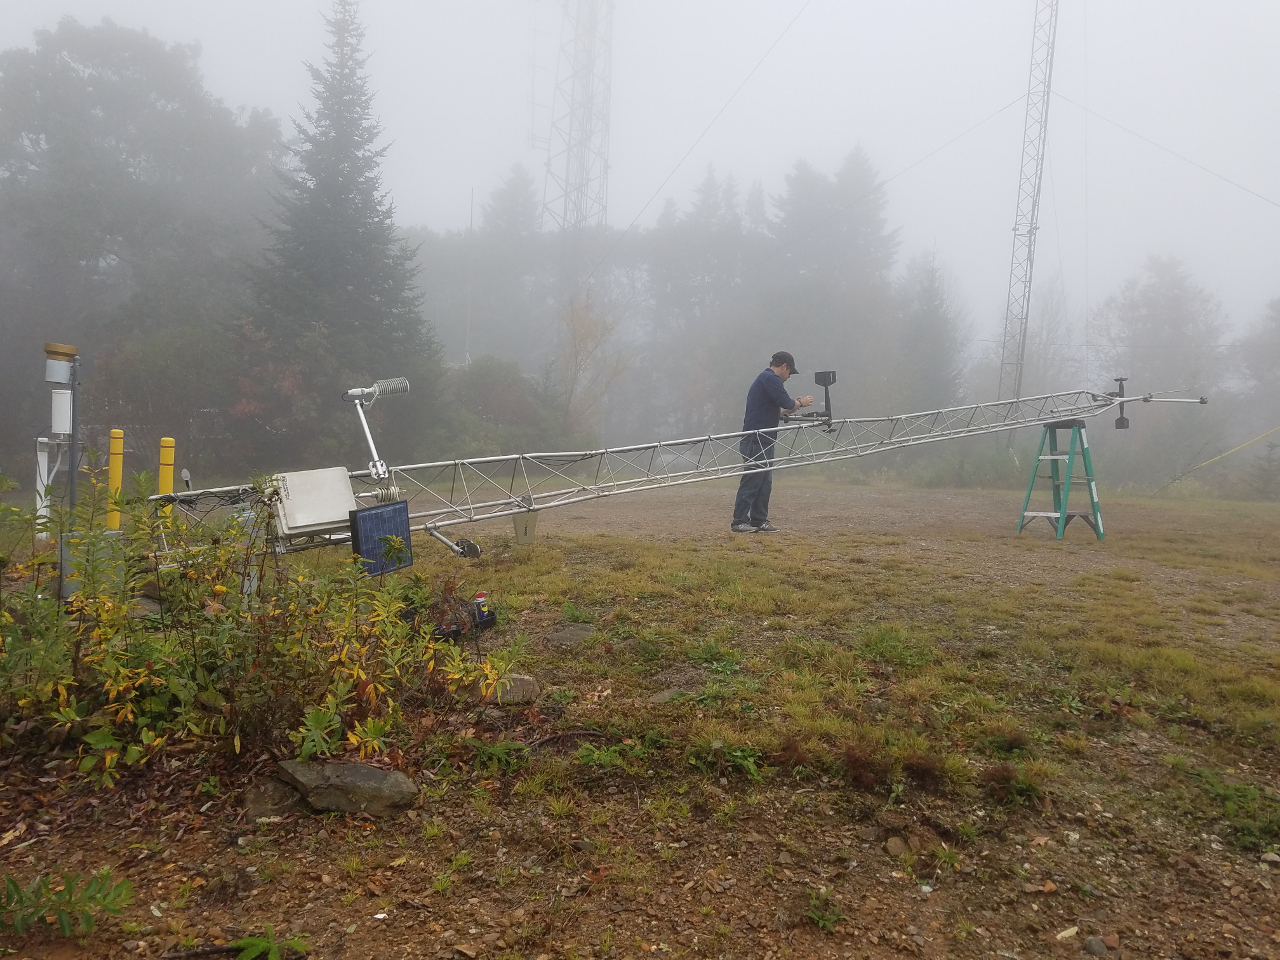
Maintenance Update
Routine maintenance is critical to the health of any weather network, and the ECONet is no different. Our technicians visit each station at least three times per year for routine maintenance, the majority of which involves clearing weeds around the tower, cleaning off sensors that have accumulated debris over the season, and re-calibrating sensors.
This fall, our technicians were busy preparing our stations for the winter. In October, we tended to our stations in the mountains, where scenic views of changing leaves and waterfalls were an added bonus.

Since weather conditions tend to be the harshest during the winter and some mountain stations can be nearly inaccessible during the winter months, it’s important to prepare our stations to meet those weather challenges. That includes replacing bearings in the anemometers to ensure accurate wind speed measurements, cleaning precipitation gauges, and testing our temperature sensors.
Putting in that work during the fall ensures that our stations are set to provide accurate information for forecasters, monitors, and decision-makers during the coming season.
- Categories:


