Climate Analysis & Visualization for the Assessment of Species Status (CAnVAS)
Under the Endangered Species Act (ESA), the US Fish and Wildlife Service (USFWS) must evaluate the status of at-risk plants and animals in the US. A Species Status Assessment (SSA) is a scientific assessment prepared for each at-risk species to help inform a range of management decisions under the ESA. SSA’s are currently needed for more than 350 species, including 250 in the Southeast alone. These species are affected by several factors including urbanization, loss of habitat, changes in streamflow and water quality, climate variability, and climate change.
Image credit: Randy Browning, USFWS.
In partnership with scientists from the USFWS and US Geological Survey, we are working on a project to develop and test data products that will assist USFWS biologists’ incorporation of climate information into SSA’s. This includes how the climate factors and thresholds that affect most species vary year-to-year, how they are expected to change in the future, and the uncertainties associated with those changes.
A key output of this project, which is supported by the Southeast Climate Adaptation Science Center as part of their goal of improving and informing decision-making related to climate change and adaptation within the Southeast region, will be a web-based collection of maps and data layers for interpreting the climate vulnerability of wildlife and their habitats. This will be delivered as a web-based interface, called CAnVAS, designed for USFWS biologists to help them assess future climate conditions and risks that may affect endangered species as part of the SSA process. Each map product in CAnVAS will focus on the most relevant climate and ecology metrics that predict species viability for a location, and include explanatory and interpretive materials.
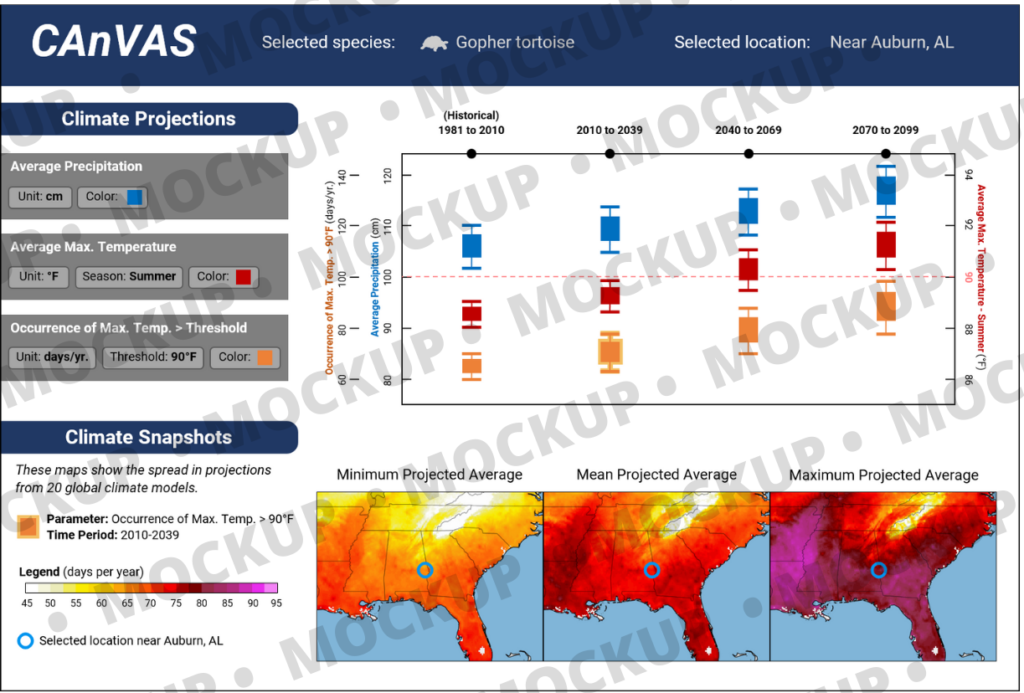
The development of the CAnVAS tool builds on the North Carolina State Climate Office’s prior experience developing the PINEMAP Decision Support System and Climate Voyager, both of which used downscaled climate projections to show current and future trends in key climate variables. We are iteratively evaluating the CAnVAS tool throughout its development cycle using several usability testing methods. An initial set of mockups for the tool were evaluated with an eye tracking study of Auburn University students. The data collected during this study helped our team assess the effectiveness of various graph formats and map colors to visualize future climate data. Later this summer, a second round of eye tracking is planned with USFWS scientists using a pilot version of the CAnVAS tool. This will be combined with qualitative data about USFWS scientists’s needs and preferences for reviewing climate information for specific species, and how this tool would fit into their SSA workflow.
The resulting CAnVAS tool will help USFWS scientists in the Southeast US obtain, understand, and apply the climate information they need, thus enhancing the accuracy, quality, and scientific rigor of SSA’s. Check back here for updates on this project and the future release of the CAnVAS tool.