Weather vs. Climate
What’s the Difference?
Weather describes conditions in the atmosphere that are happening right now. It is the short term occurrence, or daily measurement, of fair or inclement weather. For dealing with weather, daily decisions are necessary. When it is raining, bring an umbrella; when it is stormy outside, take cover inside. Daily temperature, precipitation, and severe weather are all a part of everyday weather. Click here to see current weather conditions in North Carolina.
Climate, on the other hand, describes the long-term weather patterns over a specified time frame for a specific area. We typically describe the climate of an area (be it a county, a region, or the whole globe) with long-term averages of weather conditions, usually over 30 years, termed climate normals. When we describe our climate, we’re describing what typical conditions are likely to be present at a particular location and time of year. For example, the average amount of rainfall for a location, the average temperature for summer at a specific location, and the frequency of occurrence of severe weather.
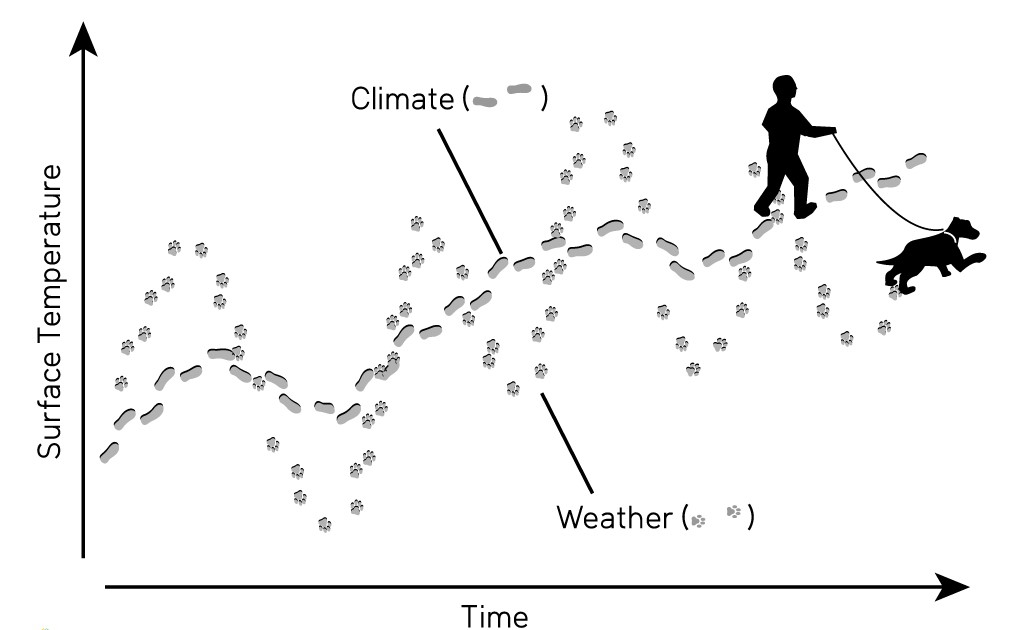
Alternatively, you can think of differences between weather and climate as comparable to differences between people’s day-to-day moods and their personalities. A person is likely to have a consistent personality over time which is described by their long-term behavior regarding: talkativeness, optimism or pessimism, and other factors. However, that person may show a lot of variation in their day-to-day moods depending on: outside influences, state of health, and even how much sleep they receive. Similarly, the climate of a region shows the long-term characteristic behavior of weather over that region. However, the weather on any particular day can be quite different depending on what weather systems are moving through the area, affecting the day’s temperatures, rainfall, and wind conditions.
What does this look like in North Carolina?
The average weather and climate conditions describe the expected weather you are likely to get. Averages are calculated using long time periods and tend to smooth out the extremes of day-to-day weather. The World Meteorological Organization defines climatological standard normals as averages of climatological data computed for consecutive periods of 30-years that encompass complete decades (e.g., 1971-2000, 1981-2010, and 1991-2020). These are used throughout the world, including in North Carolina, to describe our climate and as a reference to assess current conditions. The National Oceanic and Atmospheric Administration (NOAA) computes and provides climate normals for the US (link). The latest climate normals period available is 1991-2020.
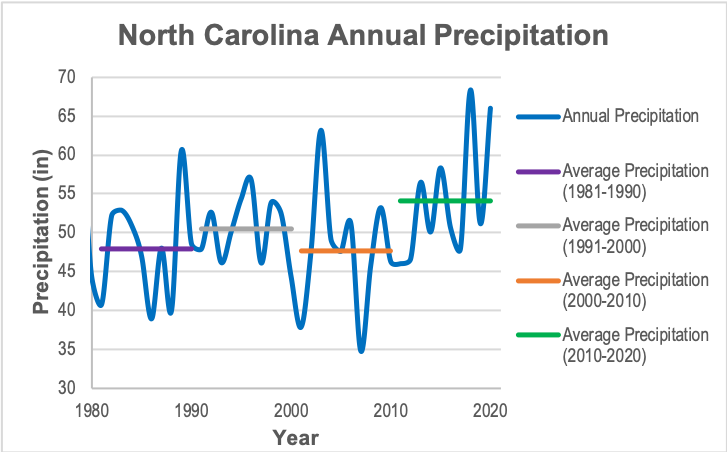
Figure A shows how average precipitation can change over different periods of time. From 1981-1990, the annual average precipitation in North Carolina is about 48 inches a year, whereas in 1991-2000 the average was about 51 inches. In 2000-2010 the ten-year average decreased back to about 48 inches, and then increased in 2011-2020 to about 54 inches. This decade-by-decade variation is caused by a number of factors, including the variability in our weather, changing ocean temperatures, regional droughts, the passage of tropical storms through the state in certain years, and anthropogenic climate changes. The exact averages depend on the years that are chosen to use for the averaging period. These changes become important when normals are calculated.
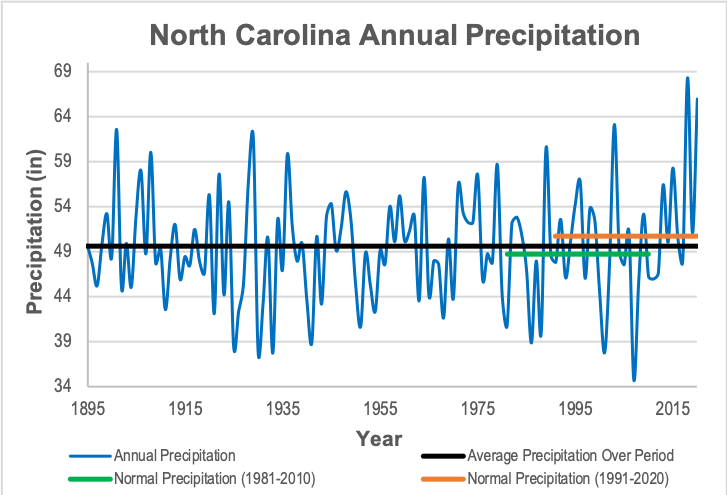
Figure B demonstrates that the 30-year normal precipitation (or temperature) for an area is not always the same as the long-term average, since they are calculated over different time periods. This particular graph shows the annual precipitation for North Carolina (blue) along with the long-term average in black and the 30-year normals corresponding to 1981-2010 (green) and 1991-2020 (orange). Observe how these lines differ based on the data for the years they contain.