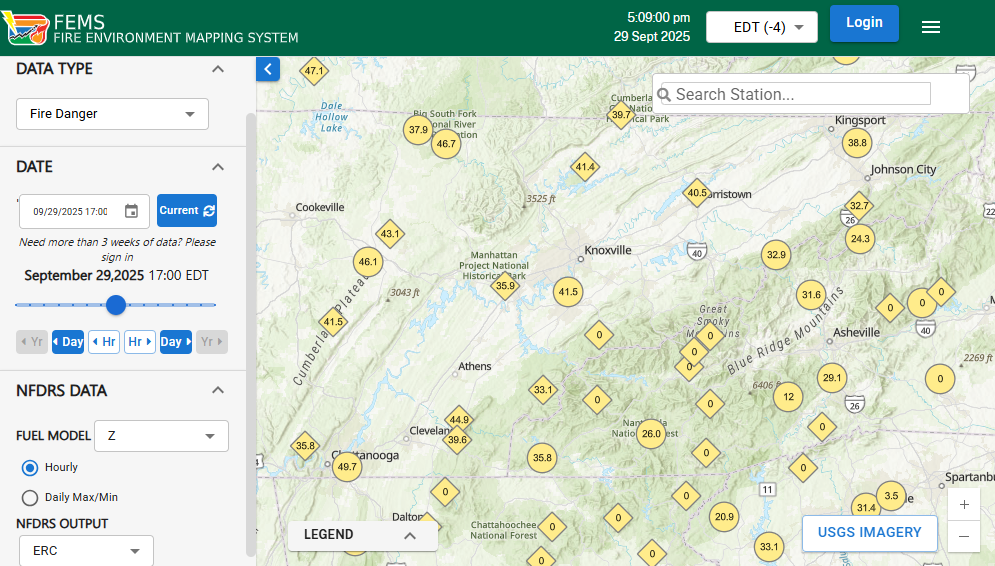
Fire danger data is getting a big change this week as its national provider shifts from the long-used WIMS system to the new Fire Environment Mapping System, or FEMS.
This update brings some exciting innovations that will improve our ability to track fire danger. Most significantly, instead of the once-daily data at 1 pm local time, FEMS is serving up hourly estimates and forecasts that should better simulate the progression of fire danger throughout the day and more accurately identify the maximum and minimum values.
Changes this big naturally require work to implement, and you can expect to see those updates rolled out both now and later in our fire weather products. Here’s an overview of what’s available now and what’s coming soon.
Rollout Wrap-Up
A year ago this month, we began our regional rollout of the updated Fire Weather Intelligence Portal. That rollout will officially finish this week, when the old Fire Weather Portal is finally shuttered beginning Wednesday, October 1. After that point, any links to the old Portal, including bookmarks of a specific page view, will automatically redirect to the new site.
FEMS Data Debuts
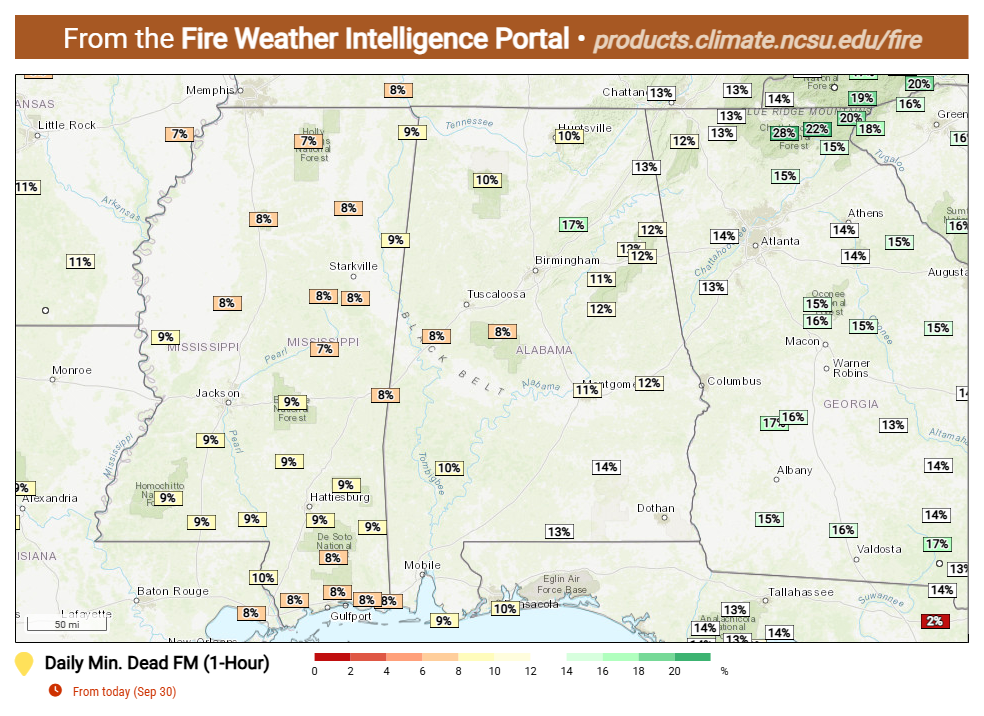
Behind the scenes, we’ve been working hard to get data downloaded from FEMS and integrated into the Fire Weather Portal. Beginning on October 1, the Portal will show daily-aggregated fire danger data, which should generally correspond to the peak fire danger each afternoon.
For some NFDRS variables (ERC, SC, IC, and BI), the daily maximum value will be displayed, while fuel moisture variables will show the daily minimum value. These variable names have been updated in the Portal to reflect the change.
Updated Tools for North Carolina
On our public-facing fire-focused website, the map of forecasted fire danger in North Carolina has been updated to use the fire danger data from FEMS. After an analysis by NC Forest Service, all of the state’s Fire Danger Rating Areas are now using fuel model Z, and the Adjective Rating shown on this map is based on the Energy Release Component with FDRA-specific breakpoints.
Note that all data should be considered interim until additional stations, historical data, and regional Growing Season Index settings are incorporated. That will lead to further evaluation to refine the fuel models, breakpoints, and fire danger indices across the region.
Future Updates
It will take a bit more time to add the hourly fire danger estimates to the menus, maps, and meteograms in the Fire Weather Intelligence Portal, so look for those in the coming months.
FEMS is now calculating National Fire Danger Rating System estimates for airport-based weather stations, which increases the density of our monitoring network across the region. Expect the addition of fire danger data for those stations in the Portal by mid-October.
Later this year, FEMS is also expected to bring in mesonet stations, including the North Carolina ECONet. Once that process is complete, we’ll work to add many of these stations in the Portal as well.
We are also planning to download historical hourly fire danger data from FEMS, which is available as far back as 2005 for some stations. This data will provide important climatological context for NFDRS and fuel moisture variables, including the historical maximum, minimum, and daily average reference lines in the meteogram plots. For now, those elements have been temporarily disabled. Until that historical data processing is complete, the DENSCA Index is also unavailable.
Finally, all of our supplemental tools will be updated soon to feature data from FEMS, along with visual changes to match the new Fire Weather Intelligence Portal. We may also improve their functionality based on feedback from state forestry services.