Over the past 15 years, the Fire Weather Intelligence Portal has gone from an isolated idea to a tool designed to aid wildfire monitoring in North Carolina to a relied-upon planning resource for the southeastern US.
In order to meet the evolving needs and growing interest across the region, the Portal has changed over time, including a region-wide expansion in 2017 and the addition of new datasets, new features, and new fuel models over time.
Some of these changes were impossible to anticipate back in 2010, when the Portal’s initial development began. For instance, while it started as a tool just for viewing weather station observations and fire danger estimates in one state, today, multiple states are using aggregations of stations in Fire Danger Rating Areas to better assess local conditions.

Changes like that, plus plenty of lessons learned over the past 15 years, invited the opportunity for an overhaul, which has been in the works over the past eleven months. Most of these updates are to the back-end architecture of the Portal, making data retrieval and aggregation more efficient and easier to update.
But there are also some front-end changes to the Portal interface — beyond just the fresh coat of paint — that should improve the overall user experience. These include:
- Reorganization of the Weather Station Data (formerly Point Data) and Spatial and Gridded Analyses (formerly Gridded Data) menus to make datasets less cluttered and easier to find
- Reference layers including current wildland fire perimeters separated into their own menu, titled Fires, Smoke, and Hazards; future additions will include satellite-detected fires and smoke plumes, plus NWS watches and warnings
- Selectable fuel models for Weather Station Data (under Advanced Settings) including the top-priority model per station as set in WIMS, the default fuel model per state or Fire Danger Rating Area, or a specific Nelson fuel model, if available at each station
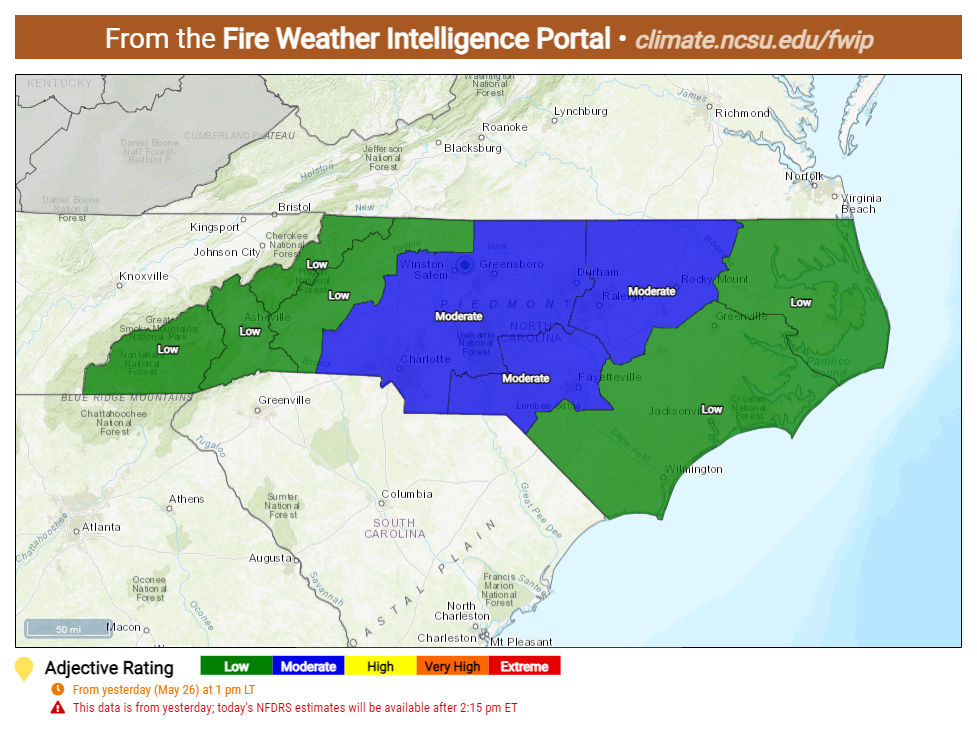
- Fire Danger Rating Area-aggregated data selectable within its own submenu under Weather Station Data, and state-level FDRA summary tables available via the map popups
- Built-in screenshot functionality for map displays, plus image and data export options available for weather station meteograms

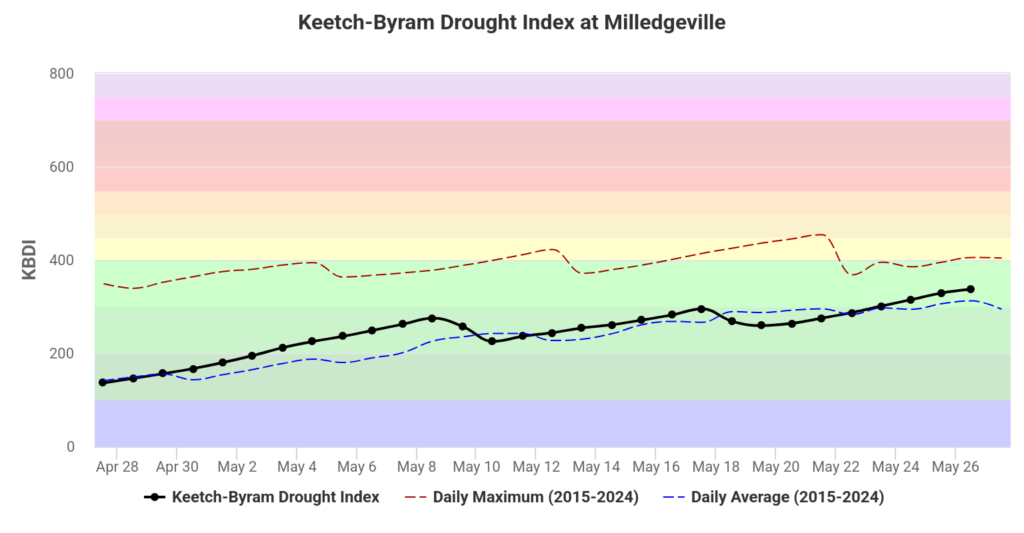
Other changes are still in development, including selectable timezones for more locally relevant data displays, an easier-to-use mobile interface, and meteograms added for gridded datasets in order to show fine-scale, grid point-level changes in weather and dispersion indices over time. More datasets — including the full suite of gridded forecast products within the existing Portal — will also be added to the new site.
While this work continues behind the scenes, the new Portal site is ready for an initial review. If you’d like to help shape the development of the site and provide feedback about the new look and functionality, please fill out this form to share your input, whether it’s a bug report or a new dataset or feature suggestion.
Updates should be completed later this summer, followed by a rollout across the Southeast region with support from US Forest Service and the Southeast Regional Climate Hub. Stay tuned to this blog for more details about rollout webinars and the full launch of the new-look Fire Weather Intelligence Portal.