El Niño Check-Up: Waiting for Local Symptoms to Start
The hype around a “Super El Niño” became contagious this summer, and for good reason: the Pacific Ocean has been warming at a near-record rate, putting this on track to be perhaps the strongest El Niño we’ve ever seen.
That has increased the likelihood of a significant and impactful event affecting North Carolina this fall and winter, even if we haven’t felt those effects just yet.
In this assessment, we’re checking El Niño’s vital signs, examining its recent spread of impacts, reviewing historical trends in North Carolina, and diagnosing when and how it may affect us in the months ahead.
Taking Its Temperature
Since last winter’s La Niña faded, we’ve seen a rapid-onset El Niño pattern take shape as measured by sea surface temperatures in the Niño3.4 region of the equatorial Pacific Ocean.
Recent daily values of the Relative Oceanic Nino Index (RONI) — which normalizes those sea surface temperatures to account for long-term ocean warming — put the current event on par with 1982 as the strongest on record at this time of year, with sea surface temperatures nearly two degrees Celsius above average.
In addition, the latest three-month average RONI of 1.4°C was behind only the 1997 El Niño in terms of strength over the June through August period.

Those values already make this a moderate to strong El Niño, and a check under the skin gives us every reason to believe that this event will continue to strengthen for a few more months.
Ocean temperatures are up to 10°C warmer than normal at a depth of only 50 to 100 meters, and as that warm water bubbles up, we should see further warming at the surface through the end of the year.
The latest outlooks from the Climate Prediction Center show a 98% chance of a very strong event – with a RONI of 2.0°C or greater – over the October through December period. Their September ENSO update also gives this event a 75% chance of becoming the strongest on record dating back to 1950.
While they correctly note that a stronger El Niño isn’t a guarantee of bigger weather impacts, it does make some impacts more likely, and we’ve already seen some of those develop over the past few months.

Symptom Check
In your body, the leg bone’s connected to the knee bone. In an El Niño pattern, the sea surface is connected to the tropical trade winds through a coupling between the ocean and atmosphere.
We watched that coupling develop this summer. Initially, warm water pooled up and was pushed eastward as low-level westerly winds developed along the equator.
Then, that warmth led to rising air and enhanced rainfall in the central and eastern Pacific, which has shown up as an increase in cloud cover and a decrease in outgoing longwave radiation.
Since June, we’ve also seen high levels of vertical wind shear across the Caribbean Sea, which hinders tropical storm development. That’s a common El Niño impact, but one that has historically emerged later in the year. In 2015, for instance, the Atlantic had nine named storms through mid-September, then just two more storms once those El Niño impacts kicked in.

The Caribbean is typically a runway in which storms can form and intensify, but with that region effectively out of play this year due to the persistent wind shear, we’ve only had six named storms so far in 2026, and most have been weak and short-lived.
In fact, this is the first time in the satellite era since 1966 that we’ve passed the climatological peak of Atlantic hurricane season without a hurricane forming.
It’s reasonable to wonder whether our recent extreme weather in North Carolina – with 90-degree temperatures lasting well into September – are connected to the increasingly extreme El Niño event.
But those symptoms are from an unrelated affliction: large-scale high pressure across the southern US, which is more of a continuation of our prevailing spring and summer pattern than a local manifestation of El Niño.

Patient History
Like the flu, El Niño’s local effects tend to be most pronounced in our cool season, from mid-fall through the winter, and this week’s 60-degree afternoons are a sign that we’re finally getting into that time of year.
Those cool-season El Niño impacts are headlined by a stronger subtropical jet stream anchored to our south, which brings moisture-rich weather systems out of the Gulf and along our coastline, making us wetter than normal overall.
The three previous strongest El Niños each had different timing for the wettest conditions in North Carolina. The 2015-16 event was wettest in the fall, while the 1997-98 event was wettest in January, and the 1982-83 event was wetter than normal in February, March, and April.
There are some commonalities, though: all three events were wetter than normal in North Carolina by November, and two of those three years saw wetter conditions emerge in October.

Of course, it’s tough to definitively attribute that wet weather to El Niño alone, but we can see some El Niño-like tendencies in the large-scale patterns during those three falls.
In 2015, a southward-diving upper-level low pressure system, fed by moisture from Hurricane Joaquin, produced a week of heavy rain in early October.
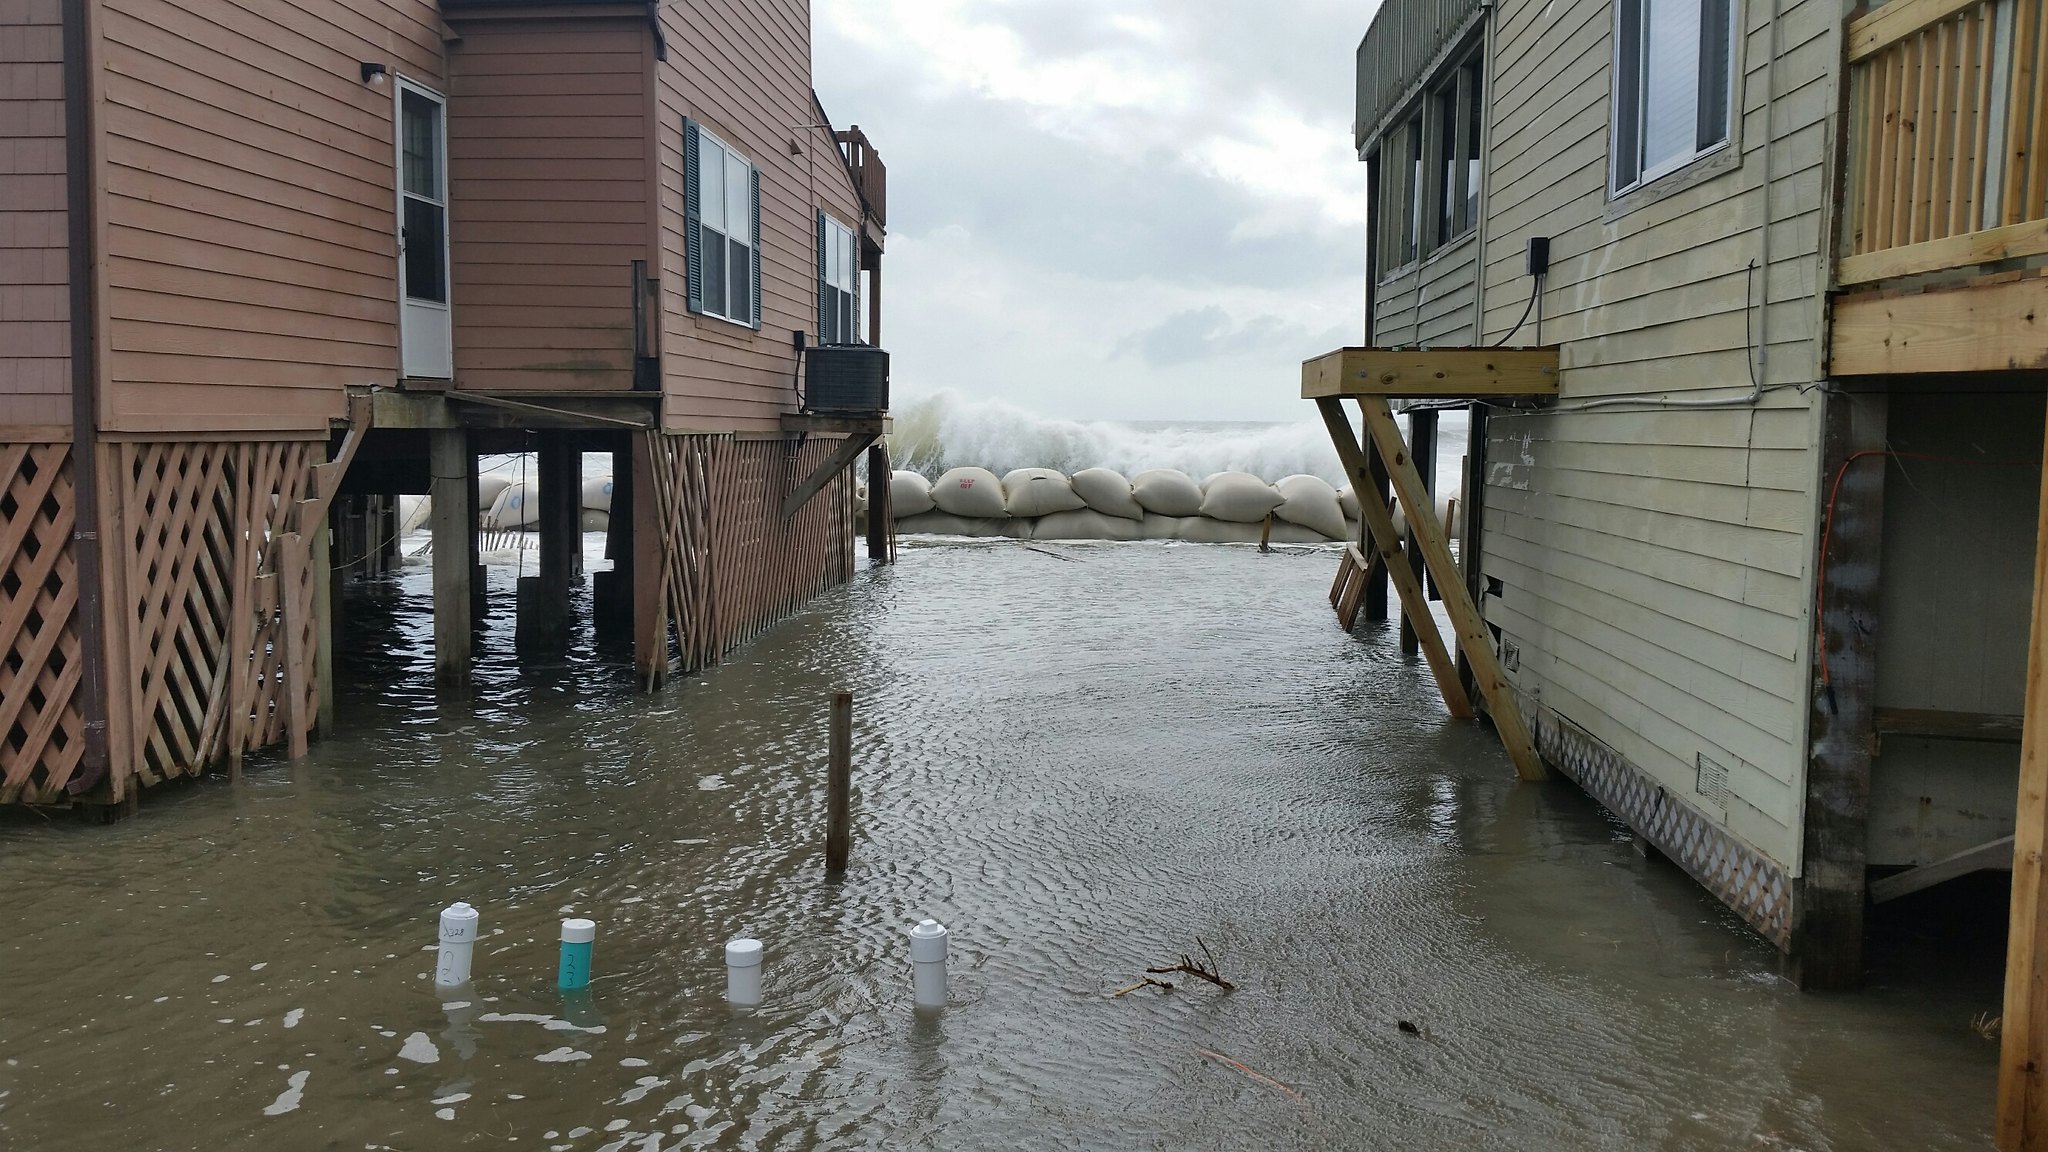
In 1982, October ended with a powerful Nor’easter that brought high winds, erosion, and overwash along the coastline, and more than four inches of rain in some areas.
And in 1997, November started with a series of three offshore low pressure systems in two weeks, which brought local rainfall totals of up to three inches at Cape Hatteras.

Prognosis and Prescription
Just like coming down with a fever means waiting for body aches and nausea to begin, with El Niño now in place, we’re anticipating its typical jet stream pattern will set up within the next few months.
The Climate Prediction Center’s latest outlooks show above-normal precipitation possible across the southern tier of the US in the first half of October, and wet weather likely for the three-month period from October through December.
When it comes to our pre-existing condition of drought, this pattern change could be just what the doctor ordered. Most of the state is more than six inches below normal since the beginning of the year, but a wet fall and winter like we had in 1997-98 (8.02 inches wetter than normal statewide) and 2015-16 (13.49 inches above normal) could neutralize those deficits and recharge low lake, soil moisture, and groundwater levels.
But this El Niño could also have some harmful side effects, including flash flooding, high winds, and erosion from more frequent storm systems; standing water and related risks such as mold growth and plant diseases; and potentially the first test of flood preparedness in the Mountains since Hurricane Helene.

As we wait for those impacts to begin, now is a great time to prepare. A good first step is clearing drainage systems, whether that’s the gutters and downspouts at our homes, the storm drains in our towns, or the ditches and pipes in farm fields.
This is also a good time to trim any trees and remove any limbs at risk of falling on properties or power lines during the expected stormy period to come. Property owners in waterfront areas may also want to have sandbags, flood barriers, and other protective measures at the ready.
And for farmers who have struggled with drought impacts over the past year, conditions may be too dry now for planting cover crops, but it could quickly become too wet for fieldwork once El Niño kicks in. Impacts will vary from farm to farm, so referring back to records from 2015 may help farmers remember how their plots and crops fared during another wet end to a year.
For now, let’s take that ounce of prevention, keep a watchful eye out for this El Niño-related pattern change, and come back for a follow-up in early November, when our annual winter outlook blog post will be released.
- Categories: