Heading into the winter, our weather predictions were literally up in the air — or perhaps out to sea — as few large-scale atmospheric patterns, including the status of the El Niño/Southern Oscillation across the equatorial Pacific Ocean, offered many helpful clues about how the season might play out.
Four months later, we’ve emerged on the other side of an extremely mild winter that, despite a few flirtations with dryness across eastern North Carolina, ended up being wet but lacking in much frozen precipitation.
In this post, we’ll review the statistics and snow totals from this past winter, look back at those pre-season predictions, and look ahead to the rest of the spring.
Seasonal Stats and Rankings
Based on data from the National Centers for Environmental Information based out of Asheville, the three-month climatological winter in December, January, and February ranked as North Carolina’s 5th-warmest since 1895, with a statewide average temperature of 46.6°F — 5.4°F above the 1901-2000 average. Four out of the past five winters are among our 15 warmest on record.
Locally, it ranked as the warmest winter in Elizabeth City dating back to 1934, the 4th-warmest winter in Greensboro and Raleigh, and the 5th-warmest in Lumberton and Wilmington.
The wintertime statewide average precipitation was 15.66 inches — our 11th-wettest out of the past 125 years, or 4.23 inches above the 1901-2000 mean.
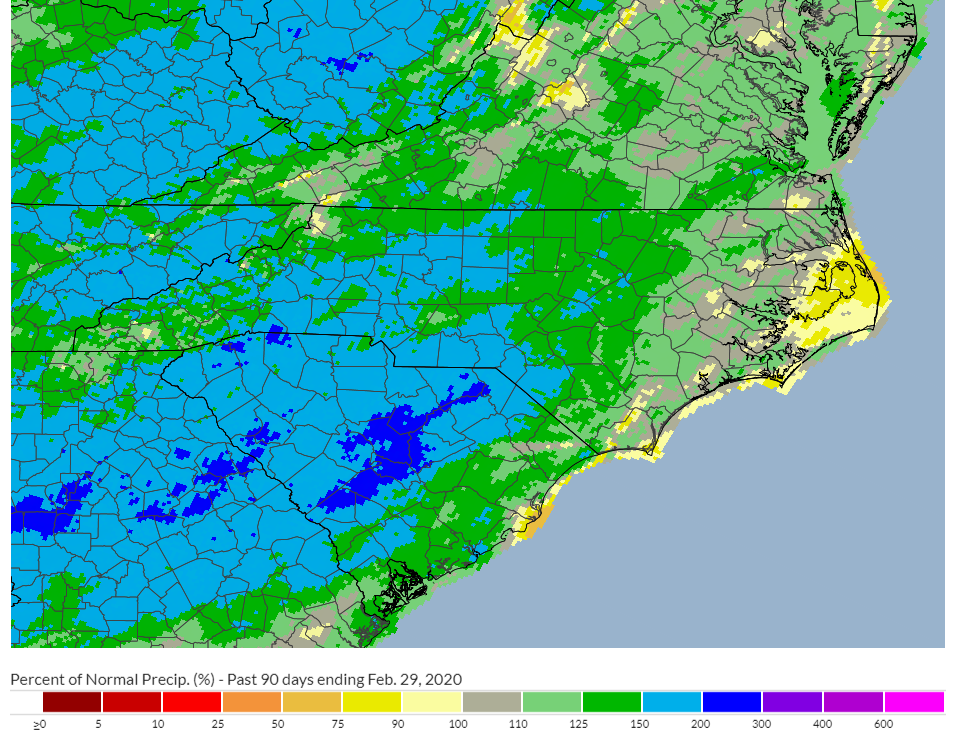
Many sites in the western half of the state recorded one of their top-five wettest winters, including the wettest in Lincolnton (20.34 inches), Boone (20.03 inches), and Hickory (18.32 inches).
Most of the winter featured a large-scale weather pattern with jet stream ridging over the eastern US, which gave us such warm temperatures. The storm track just to our west brought numerous cold fronts over the Mountains, but early in the season, these systems dried out by the time they reached the coast.
After missing out on many of those rain events, the immediate coast was classified as Abnormally Dry on the US Drought Monitor by late January. However, the February pattern saw the jet stream sag southward a bit, bringing more storm systems along our coast to sufficiently soak those dry areas.
Snow Totals
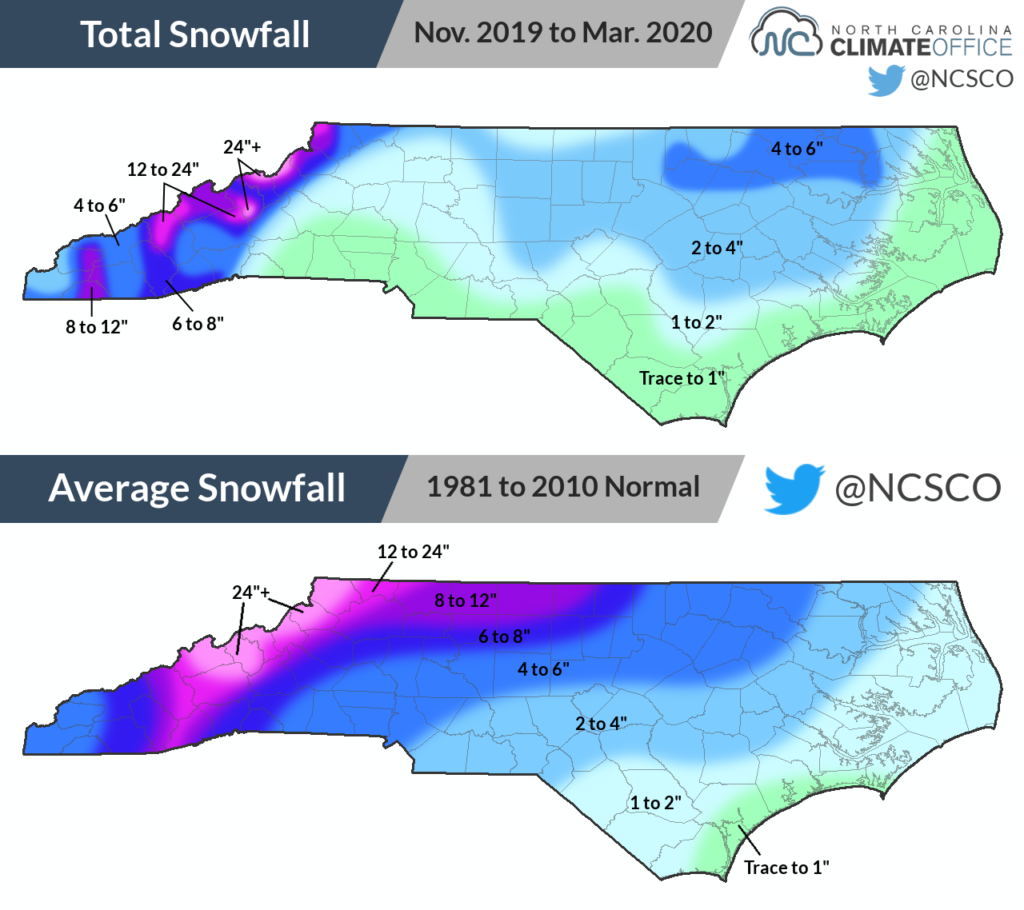
Mid-February featured the lone wintry event of the season for most of the state. On February 20 and 21, up to 4.5 inches of snow fell in Northampton County as low pressure tracked up the coast while high pressure to our north kept cold air locked in place near the surface.
That event kept it from being a snow-free season in most spots, but the total seasonal snowfall was still below normal across the state.
In the Mountains, Asheville picked up just 3.0 inches total, well below its seasonal normal of 9.9 inches. Even Mount Mitchell, which averages 92.3 inches of snow per year, only picked up 52.2 inches this winter.
The 0.3 inches in Charlotte was well below it’s 4.3-inch normal. This was Charlotte’s sixth consecutive winter with below-normal snowfall.
Greensboro (2 inches) and Raleigh (2.5 inches) also had less than their normal snowfall of 7.6 inches and 5.9 inches, respectively.
Predictions Reviewed
Entering the winter, there was plenty of uncertainty surrounding the seasonal outlooks. The El Niño/Southern Oscillation was expected to be in a neutral phase throughout the season, which generally has less influence over the large-scale jet stream patterns and, in turn, our weather.
That meant our winter would come down to more local or regional patterns. The Arctic Oscillation, for instance, describes conditions near the North Pole, and it was in a positive phase nearly all winter, meaning a stronger upper-level circulation with little cold air diving southward.
In our Winter Outlook released in November, we outlined a few different jet stream setups and suggested that some combination of those would likely dictate our weather throughout the season.
The prevailing pattern this winter was a combination of the “Warm and Dry” setup, with ridging in the polar jet stream that kept temperatures above normal across the eastern US, and the “Warm and Wet” pattern with Gulf moisture fueling wet weather, especially in western North Carolina.
Our February snow event was the lone notable occurrence of the “Cool and Wet” pattern, while we never really saw signs of being “Cool and Dry”.
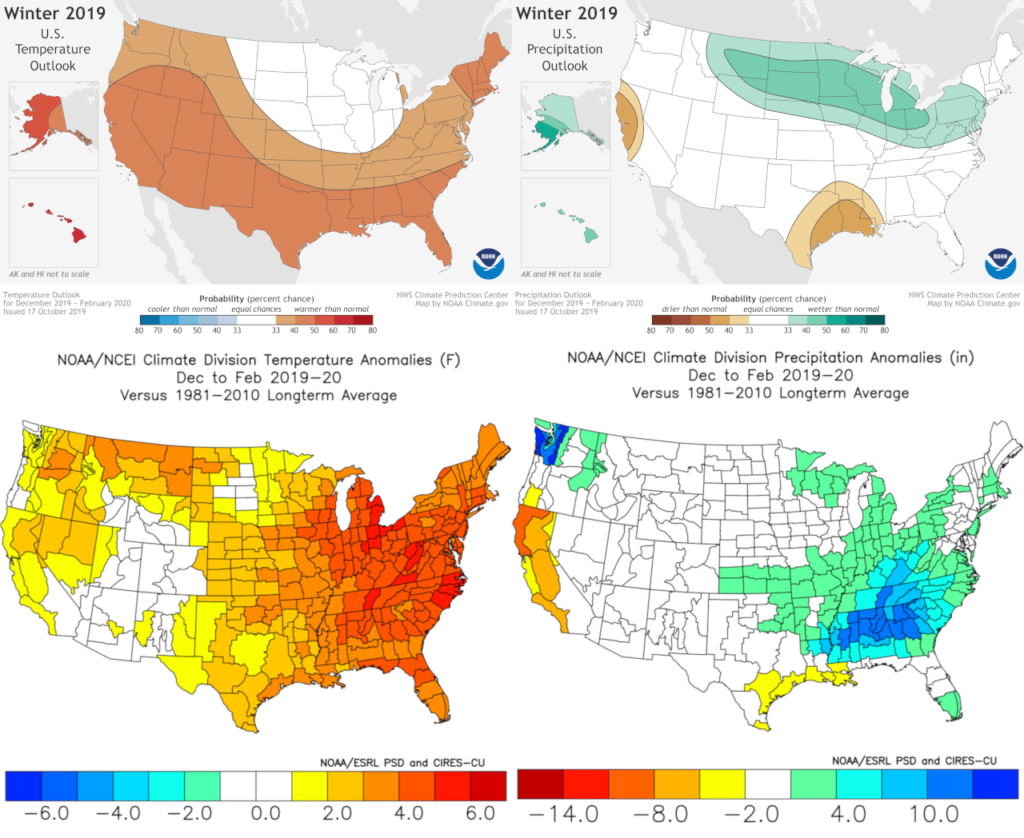
NOAA’s official winter outlook, as well as our own, called for near- to above-normal temperatures overall, which was the case in North Carolina. Without the sometimes-strong arm of ENSO exerting much influence over the atmosphere, we expected a more variable weather pattern, with periods of warm, cool, wet, and dry.
That was somewhat the case, but all three winter months — December, January, and February — ranked as warm and wet statewide, so the pattern was a bit more stable — or stubborn, if you hoped for more cold and snow — than we expected.
Among nature’s purported predictors, “Wild Worm Will”, the winner of last year’s Woolly Worm Festival in Banner Elk, apparently called for a cool start with milder weather to follow, as foretold by the black and brown coloring of its body segments.
(As we’ve discussed in the past, woolly worms change color as they shed their outer layers each summer and fall, so their colors may be less of a weather prediction than an indicator of how quickly they started growing the previous spring.)
Sir Walter Wally, North Carolina’s official groundhog at the Museum of Natural Sciences in Raleigh, saw his shadow and predicted six more weeks of winter.
Those six weeks following Groundhog Day did include Raleigh’s lone snow event, but were generally warm, especially in the first half of March.
Spring Outlook
So far, we have started the spring on a warm note, with several days already reaching the 80s in March, but also on a dry one. In recent weeks, the heaviest rain has fallen west of the Appalachians over the Mississippi and Ohio river valleys.
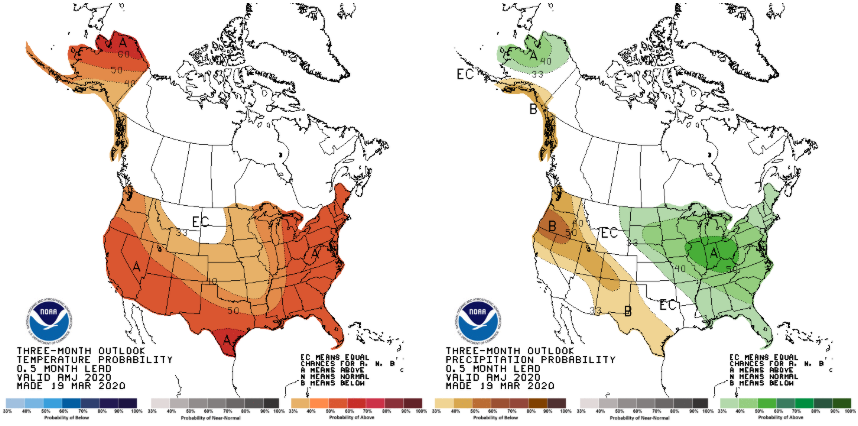
Over the next three months from April through June, the Climate Prediction Center expects that temperature pattern to hold. Their outlook gives at least a 50% chance of above-normal temperatures over the eastern US.
Parts of that region look to be a bit wetter as well, with elevated odds of above-normal precipitation east of the Mississippi River.
Current medium-range forecasts show little risk of freezing temperatures outside the Mountains through early April, which corresponds to the typical last freeze date across most of the state. While we have had a later freeze than that — as late as May 2 in 1963 — our ongoing warm pattern makes such an event less likely.
As the growing season begins in earnest, attention will turn to factors such as evapotranspiration rates and soil moisture availability, which is generally good in the top 4 inches at the moment with some drier spots in the Sandhills and southern Coastal Plain.
We will also see our precipitation regime change from low pressure systems bringing widespread rain to more scattered showers and thunderstorms, which might soak your backyard while your friends across town receive little to nothing.
To help forecasters, climatologists, and researchers better monitor precipitation totals across the state and capture these local differences, consider signing up to be a CoCoRaHS observer and reporting the rainfall you receive at your home.
Those reports are a big help for meteorologists, and if you sign up during the month of March, you could even help North Carolina rise up the March Madness leaderboard for new registered observers!